
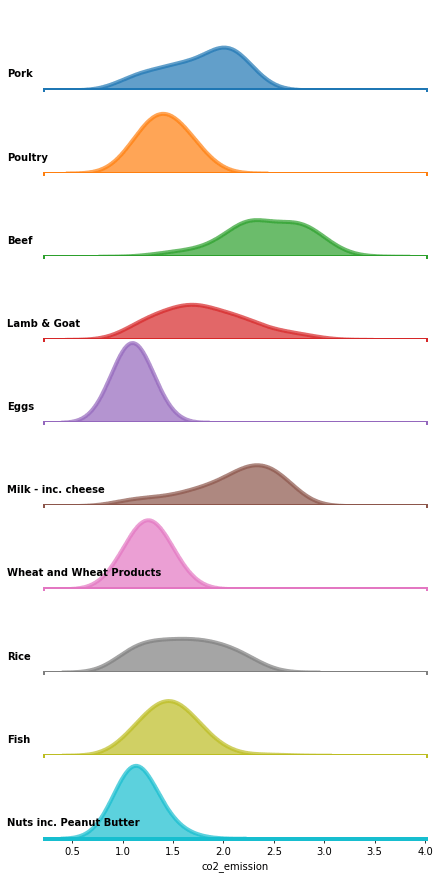
Ridgeline plots are great to visualize numerical distributions corresponding to multiple groups or categorical variables. Ridgeline plots make density plots or histograms for each group one on top of each other and thus making it look like “a mountain range”. They are great for visualizing changes in numerical distributions over time or space. Claus Wilke… Continue reading How To Make Ridgeline plot in Python with Seaborn?