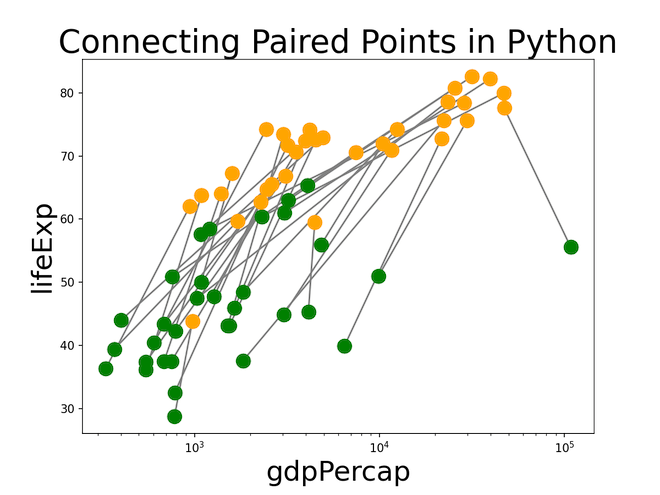
In this tutorial, we will learn how to connect paired data points with lines in a scatter plot using Matplotlib in python. Adding lines to paired data points can be extremely helpful in understanding the relationship between two variables with respect to a third variable. Mainly we use Matplotlib’s plot() function and scatter() function to… Continue reading How To Connect Paired Data Points with Lines in Scatter Plot with Matplotlib
How to Add Legend to Scatterplot Colored by a Variable with Matplotlib in Python
Matplotlib, one of the powerful Python graphics library, has many way to add colors to a scatter plot and specify legend. Earlier we saw a tutorial, how to add colors to data points in a scatter plot made with Matplotlib‘s scatter() function. In this tutorial, we will learn how to add right legend to a… Continue reading How to Add Legend to Scatterplot Colored by a Variable with Matplotlib in Python
Visualizing Missing Data with Barplot in R
One of the common data exploring activities is to quickly have an understanding of the exten of missing data in a data set. There are a few quick ways to make a visualization of missing data. In this tutorial we will learn how to make stacked barplot with counts and proportion of missing data in… Continue reading Visualizing Missing Data with Barplot in R
Visualizing Missing Data with Seaborn Heatmap and Displot
Understanding the level of missing data in the data set analysis should be one of the first things we all should do while doing data analysis. In this post, we will use Python’s Seaborn library to quickly visualize how much data is missing in a data set. One of the ways to visualize the missing… Continue reading Visualizing Missing Data with Seaborn Heatmap and Displot
How to Make Grouped Barplots with Same Bar Width
Grouped barplot allows to show third categorical variable in the barplot. Sometimes, when we make grouped barplot using ggplot2, some of the bars would have much broader width sizes. We typically get bars with uneven widths in a grouped barplot when some of the groups don’t have data for all of its levels. In this… Continue reading How to Make Grouped Barplots with Same Bar Width
