
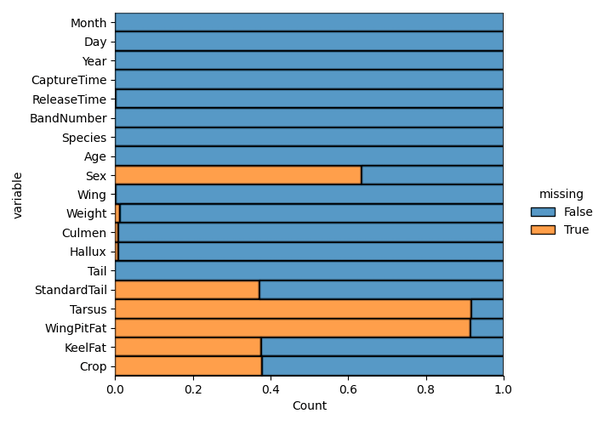
Understanding the level of missing data in the data set analysis should be one of the first things we all should do while doing data analysis. In this post, we will use Python’s Seaborn library to quickly visualize how much data is missing in a data set. One of the ways to visualize the missing… Continue reading Visualizing Missing Data with Seaborn Heatmap and Displot