One of the great things about making plots with ggplot2 is that it offers a number of ways to add colors to the plots. We can use ggplot2’s default options for adding colors to plots. However, sometimes one might want to manually specify colors to a plot. There are a few ways to manually specify colors with ggplot2.
In this post, we will see a simple example of how to manually specify colors while making barplot with ggplot2. We will use the specific colors to fill the bars and color them in barplot made with geom_col() function in ggplot2.
To get started, let us load tidyverse and set black and white theme.
library(tidyverse)
theme_set(theme_bw(16))
We will use Penguins dataset to make the barplot. Here we load the data from datavizpyr’s github page.
penguins <- readr::read_tsv("https://raw.githubusercontent.com/datavizpyr/data/master/palmer_penguin_species.tsv")
── Column specification ────────────────────────────────────────────────────
cols(
  species = col_character(),
  island = col_character(),
  culmen_length_mm = col_double(),
  culmen_depth_mm = col_double(),
  flipper_length_mm = col_double(),
  body_mass_g = col_double(),
  sex = col_character()
)
Let us compute average weight for three penguin species.
df <- penguins %>%
  group_by(species) %>%
  summarize(ave_bodymass=mean(body_mass_g, na.rm=TRUE))
df
And we will make bar plot of the mean weight in grams with ggplot2.
species ave_bodymass
Adelie	3700.662
Chinstrap	3733.088
Gentoo	5076.016
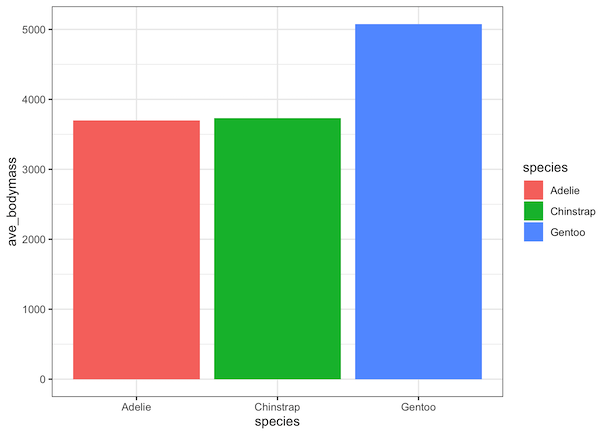
In this barplot, we add colors to the bars using “species” variable with fill argument. T
df %>%
  ggplot(aes(species, ave_bodymass, fill = species)) +
  geom_col()
  #scale_fill_identity()
ggsave("ggplot_barplot_default_colors.png")
This yields a simple barplot colored by the variable.
If we want to color each specify by a specific color, one of the ways to do it is to create new color variable with the specific color of interest.
We use mutate() function to add color for each species. Now we use the “color” variable to add colors using the fill argument.
df %>%
  mutate( color = c("#009E73", "#D55E00", "#000000")) %>%
  ggplot(aes(species, ave_bodymass, fill = color)) +
  geom_col(alpha = 0.5) +
  scale_fill_identity()
ggsave("manually_specified_colors_barplot_ggplot.png")
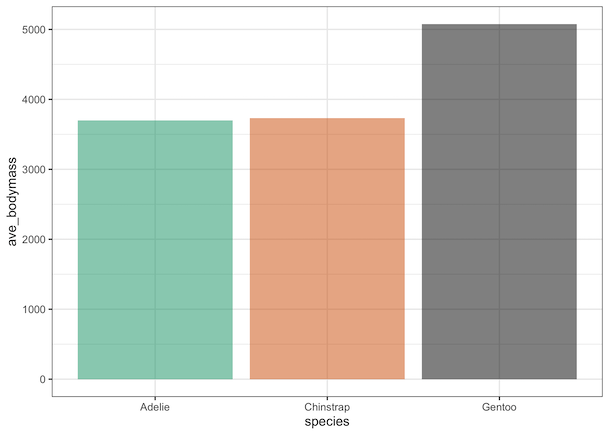
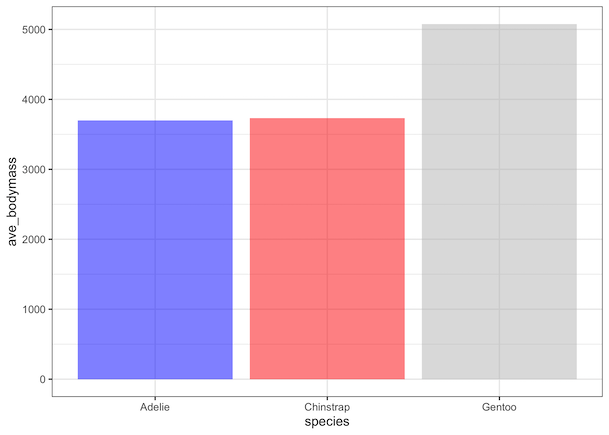
In the previous example, we specified a color for each species using hex code for colors. Instead , we can also specify the name of the colors.
Below, we specify colors using the names instead of hex codes and make a barplot.
df %>%
  mutate( color = c("blue", "red", "grey")) %>%
  ggplot(aes(species, ave_bodymass, fill = color)) +
  geom_col(alpha = 0.5) +
  scale_fill_identity()
ggsave("specify_colors_barplot_ggplot.png")
Although we could manually specify colors for barplot, there are other better ways to specify colors. We will see better ways to specify colors in another post soon.