
ggplot2 adds colors to its plot automatically. Sometimes you might want to get the list of colors (color codes) that ggplot2 uses. In this post, we will learn how to get the color codes that ggplot2 uses by default in a plot. We will use scales package in tidyverse to get the colors for different number of levels and also visualize them.
Let us load tidyverse and scales package.
library(tidyverse)
library(scales)
Get ggplot2 color codes with hue_pal() function in scales package
scales package’s hue_pal() function gives the discrete color codes that ggplot2 uses for any levels in a ggplot2. For example, to get the color codes used in a plot with two levels, we use
hue_pal()(2)

## [1] "#F8766D" "#00BFC4"
Similarly, to get the color codes used in a plot with four levels, we use
hue_pal()(4)

## [1] "#F8766D" "#7CAE00" "#00BFC4" "#C77CFF"
hue_pal() function in scales package can also take in direction, range of hue to use and intensity of color to get more specific color codes for a given level. For example to get the colors in reverse order we use
scales::hue_pal(direction=-1)(2)

## [1] "#00BFC4" "#F8766D"
Visualize the ggplot2 default colors with codes using show_col() function in ggplot2
scales package also show_col() function to visualize the default ggplot2 color codes easily in a a grid. For example to visualize the colors of a plot with 4 levels with the color code, we can use
show_col(hue_pal()(4))

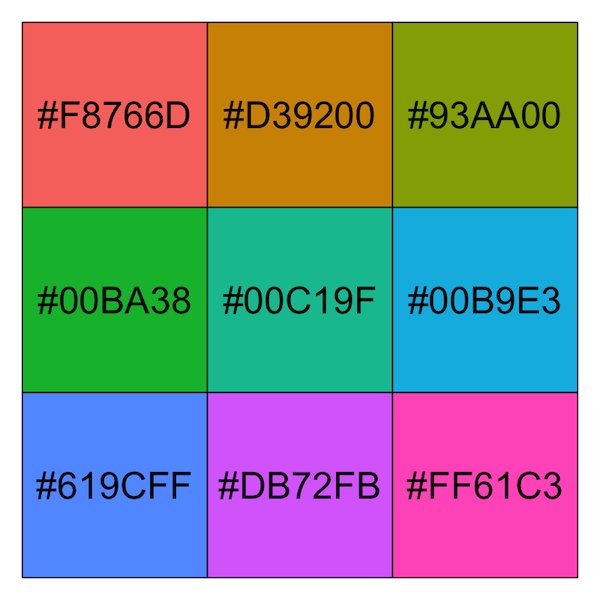
Here we visualize the colors with color codes ggplot2 uses for a plot with 9 levels.
show_col(hue_pal()(9))
Check out more options using hue_pal() in scales package with hue_pal()’s documentation page.


