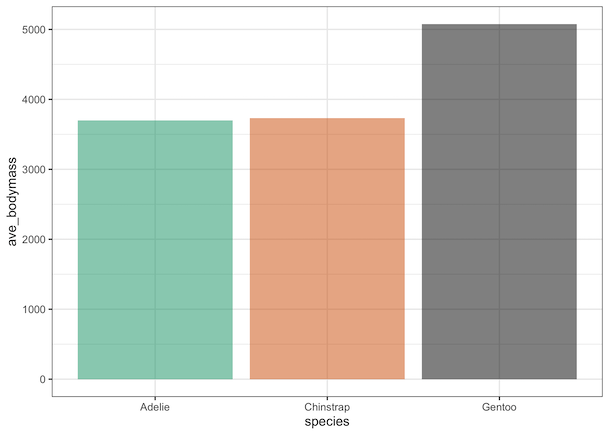
One of the great things about making plots with ggplot2 is that it offers a number of ways to add colors to the plots. We can use ggplot2’s default options for adding colors to plots. However, sometimes one might want to manually specify colors to a plot. There are a few ways to manually specify… Continue reading How To Manually Specify Colors for Barplot in ggplot2?
