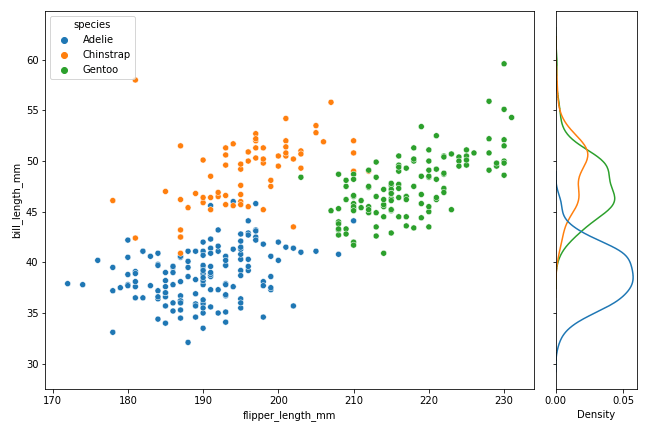
In this tutorial, we will see how to join or combine two plots with shared y-axis. As an example, we will make a scatterplot and join with with marginal density plot of the y-axis variable matching the variable colors. Thanks to Seaborn’s creator Michael Waskom’s wonderful tip on how to do this. Let us get… Continue reading How to Combine Two Seaborn plots with Shared y-axis
Author: datavizpyr
How To Manually Specify Palette Colors in Seaborn
When we make a plot with Seaborn, say a scatterplot using Seaborn’s scatterplot and color the groups of the data using a grouping variable, Seaborn chooses suitable colors automatically. Sometimes you might like to change the default colors to colors of your choice. In this post, we will see how to manually specify colors to… Continue reading How To Manually Specify Palette Colors in Seaborn
How to Customize Titles in Multi-Panel plots with Seaborn?
Multi-panel plots or small multiples are a great way visualize the relationship between two variables with respect ot the values of other variables. Seaborn offers a few different ways to make a multi-panel plots, with FacetGrid is the class behind multi-panel plots in Seaborn. In this post, we will see how can we customize the… Continue reading How to Customize Titles in Multi-Panel plots with Seaborn?
Pandas Bootstrap_plot(): Understand uncertainty
One of the key parts of data analysis is to use summary statistics to understand the trend in the data. Understanding the variability in such summary statistics can be extremely useful to put weight on such summary statistics. Bootstrapping, resampling data with replacement is an extremely useful tool to quantify uncertainty. It was originally developed… Continue reading Pandas Bootstrap_plot(): Understand uncertainty
How to Make Grouped/Stacked Barplot in R?
When you have dataset with two categorical variables and one quantitative variable, a grouped barplot is a great way to see the relationship among the variable. In a simple barplot, we have categorical variable on x-axis and have bars showing the numerical value of the quantitative variable. In a grouped barplot, we add the third… Continue reading How to Make Grouped/Stacked Barplot in R?
