
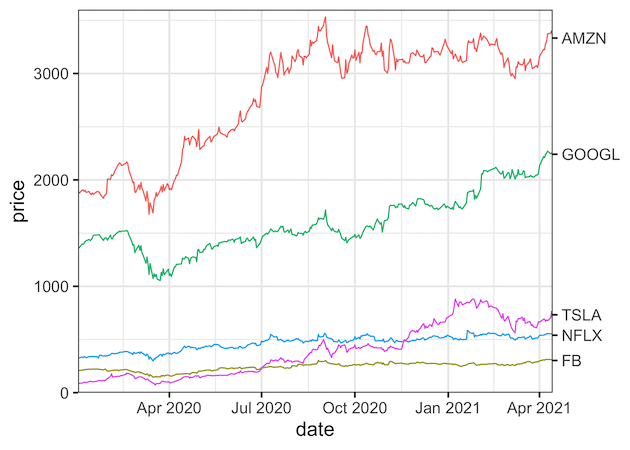
Legends can be of great help to understand a plot. Typically, ggplot2 adds legend by default on right side of the plot based on the variable that we used to color or fill. However, as Cluas Wilke says in his fantastic book on Data Visualization, legends can make the plot difficult to understand as well.… Continue reading How to Add Labels Directly in ggplot2. Hint: Use Secondary Axis Trick