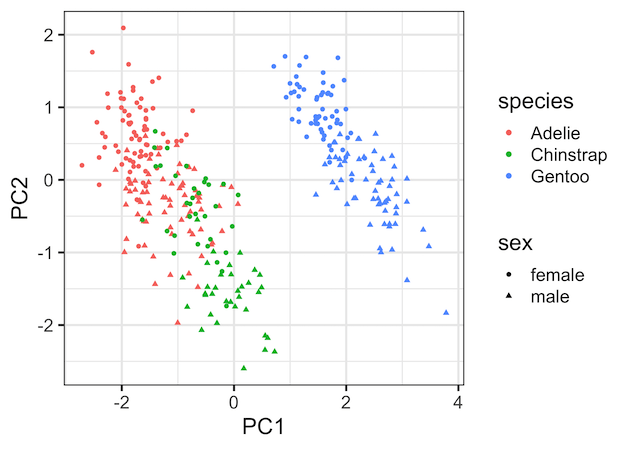
Principal Component Analysis (PCA) is one of the commonly used methods used for unsupervised learning. Making plots using the results from PCA is one of the best ways understand the PCA results. Earlier, we saw how to make Scree plot that shows the percent of variation explained by each Principal Component. In this post we… Continue reading How To Make PCA Plot with R
