
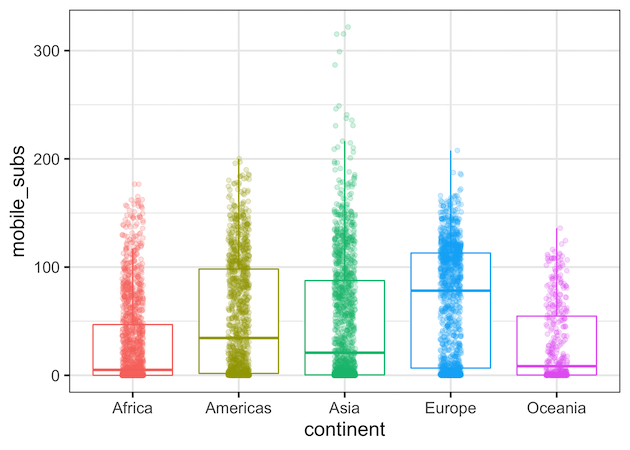
Making a boxplot with data points on top of the boxplot is a great way to show distributions of multiple groups. A big advantage is that one can see the raw data and the summary stats of distributions using boxplot with data points. ggplot2 in R makes it easy to make boxplots and add data… Continue reading A mistake to Avoid while making boxplot with datapoints in ggplot2
Tag: ggplot2 Boxplot
How to Color Boxplots with R Colorbrewer Color Palettes?


Adding right colors to the plots greatly help convey the main message of the plot. Adding colors manually can be a bit challenging. Color palettes available from RColorBrewer package make it easy add right set of colors to plots made with ggplo2. In this tutorial, we will see examples of adding colors to Boxplots using… Continue reading How to Color Boxplots with R Colorbrewer Color Palettes?