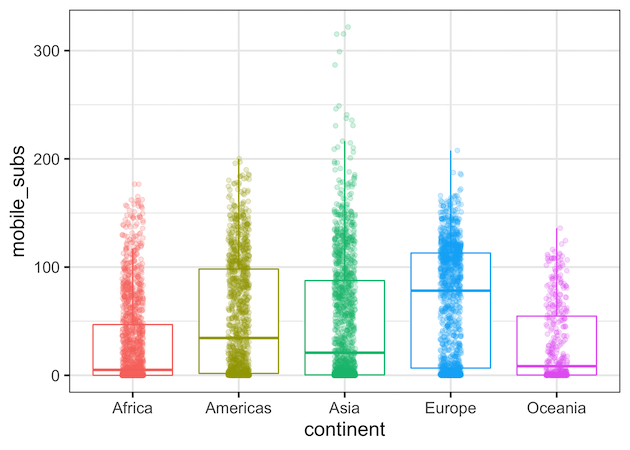
Making a boxplot with data points on top of the boxplot is a great way to show distributions of multiple groups. A big advantage is that one can see the raw data and the summary stats of distributions using boxplot with data points. ggplot2 in R makes it easy to make boxplots and add data… Continue reading A mistake to Avoid while making boxplot with datapoints in ggplot2
