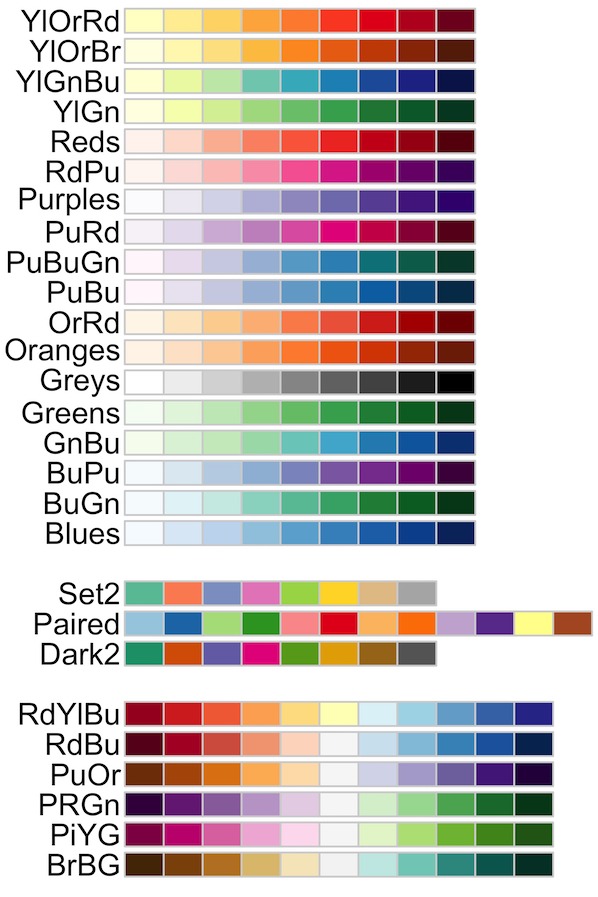
RColorBrewer is a R package based on colorbrewer2.org that offers a variety of color palettes to use while making plots in R. Choosing which colors to use while making data visualization is not an easy task.
In this tutorial we will see the basics of color palettes available with RColorBrewer package. A Color palette is a set of colors that can be go together well while making a plot. For example, a color blind friendly color paletter would contain colors that will be visible to people with color blindness.
We can install RColorBrewer from CRAN
# install RColorBrewer
install.packages("RColorBrewer")
RColorBrewer uses colorbrewer2.org and offers three kinds of color palettes for most common use case scenario in making plots. The three kind of color palettes from RColorBrewer are Sequential color palettes, Diverging Color Palettes and Qualitative Color Palettes.
RColorBrewer also offers functionalities to quickly visualize the color palettes and to help choose the color palettes.
The Sequential palettes “are suited to ordered data that progress from low to high”. We can see the names and color palettes using
display.brewer.all(type="seq")
The Diverging palettes help emphasize the middle values and to the both side of the end values.
display.brewer.all(type="div")
And the Qualitative palettes help create the primary visual differences between classes/groups.
display.brewer.all(type="div")
We can also get all the information about the color palettes as a data from using brewer.pal.info. The dataframe contains maximum number of colors available for a color palette, its category whether it is diverging/sequential/quantitative and if the color palette is color blind friendly or not.
brewer.pal.info %>%
      head()

##      maxcolors category colorblind
## BrBG        11      div       TRUE
## PiYG        11      div       TRUE
## PRGn        11      div       TRUE
## PuOr        11      div       TRUE
## RdBu        11      div       TRUE
## RdGy        11      div      FALSE
We can use the data frame to slice and dice and view select color palettes. For example, we can visualize all color blind friendly color palettes using
brewer.pal.info %>%
filter(colorblind==TRUE)
We can also view all the color blind friendly palettes using
display.brewer.all(colorblindFriendly=TRUE)
