Dealing with long, overlapping axis labels that make your ggplot2 visualizations unreadable? This comprehensive guide shows you exactly how to wrap axis labels ggplot2 into multiple lines with ready-to-use code examples.
Long axis labels are a common problem in data visualization, especially when working with categorical data, survey responses, or detailed variable names. When axis labels overlap or extend beyond plot boundaries, they compromise both aesthetics and readability. Fortunately, ggplot2 offers several elegant solutions to wrap long axis labels into clean, multi-line text.
In this tutorial, you’ll master ggplot2 axis label wrapping using the stringr package, scales package, custom functions, and manual line breaks. Whether you’re preparing plots for publications, presentations, or web dashboards, these techniques will ensure your axis labels remain readable and professional.
What You’ll Learn:
- ✅ 4 different methods to wrap axis labels in ggplot2
- ✅ Using stringr::str_wrap() for automatic wrapping
- ✅ Implementing scales::label_wrap() function
- ✅ Creating custom wrapper functions
- ✅ Manual line breaks with \n character
- ✅ Best practices for readable multi-line labels
- ✅ Troubleshooting common wrapping issues
First, let us load tidyverse suit of R packages.
library(tidyverse)
theme_set(theme_bw(18))
To make a simple barplot with really long axis tick labels, let us create a simple dataframe using tibble() function.
df <- tibble(label_grp = c("short", "Medium label",
                          "a very long axis label that needs to be folded"),
              some_value = c(13633,20824,42000)
)
Our data for barplot looks like this.
df

## # A tibble: 3 × 2
##   label_grp                                      some_value
##   <chr>                                               <dbl>
## 1 short                                               13633
## 2 Medium label                                        20824
## 3 a very long axis label that needs to be folded      42000
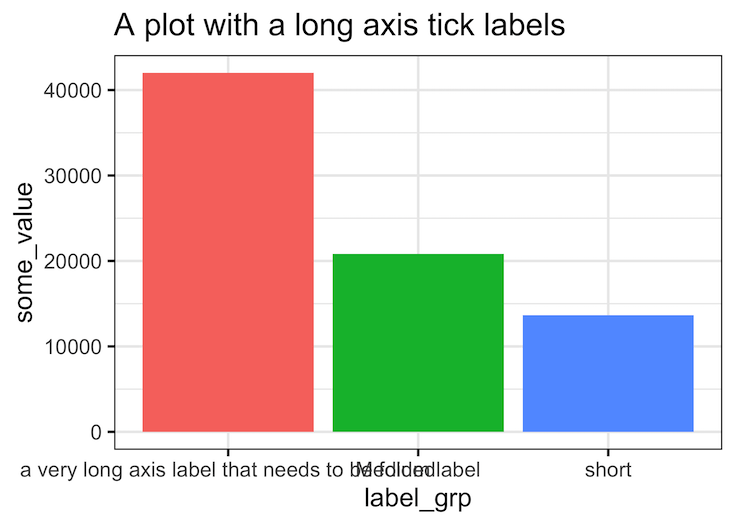
If we make a barplot, we can see that a really long axis tick label overlaps with the next label.
df %>%
  ggplot(aes(x = label_grp,
             y = some_value,
             fill = label_grp))+
  geom_col()+
  theme(legend.position = "none")+
  labs(title="A plot with a long axis tick labels")
Wrapping long labels into multiple lines with stringr::str_wrap() function
Let us use str_wrap() function in stringr R package to specify the width of the label text. We specify labels argument to scale_x_discrete() with a function that wraps the label text to the width we like. In this example we use width of 15 characters.
df %>%
  ggplot(aes(x=label_grp, y=some_value,
             fill=label_grp))+
  geom_col()+
  scale_x_discrete(labels = function(x)
    stringr::str_wrap(x, width = 15))+
  theme(legend.position = "none")
ggsave("wrap_long_axis_tick_labels_into_multiple_lines_R.png")
Now the we call see that all label texts greater than the width of 15 chars is wrapped into two or more lines.

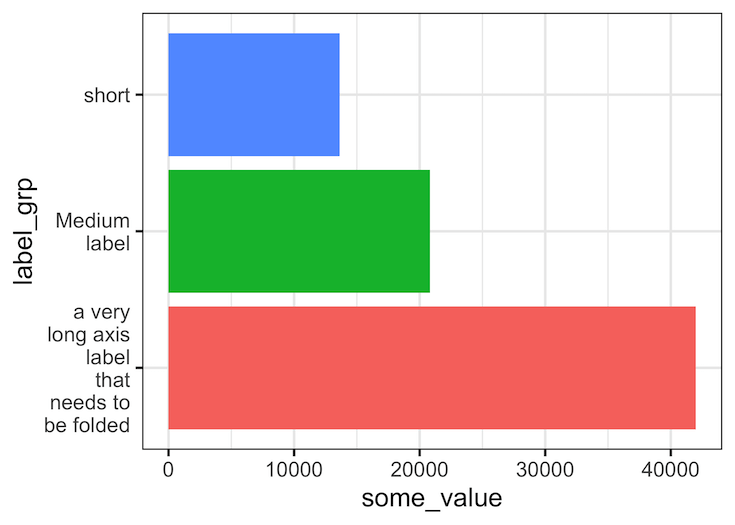
Wrapping long labels into multiple lines with stringr::str_wrap() function with axis flipped
In this example, in addition to wrapping long axis labels into multiple lines, we also flip the axes to make reading the labels easier.
df %>%
  ggplot(aes(y=label_grp, x=some_value,
             fill=label_grp))+
  geom_col()+
  scale_y_discrete(labels = function(x) str_wrap(x, width = 15))+
  theme(legend.position = "none")
ggsave("how_to_wrap_long_axis_tick_labels_into_multiple_lines_R.png")


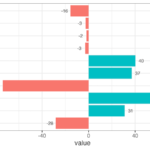
Wrapping long axis tick labels across multiple lines with scales::label_wrap()
Another easier way to wrap long labels to multiple lines is to use scales package’s function label_wrap(). With label_wrap() we don’t have to write a function as before, instead we just provide the width we need as argument.
df %>%
  ggplot(aes(y = label_grp,
             x = some_value,
             fill = label_grp))+
  geom_col()+
  scale_y_discrete(labels = scales::label_wrap(10))+
  theme(legend.position = "none")

ggsave("wrap_long_labels_across_multiple_lines_with_scales_label_wrap.png")
Label Wrapping Methods Comparison
| Method | Package Required | Ease of Use | Flexibility | Best For |
|---|---|---|---|---|
| str_wrap() | stringr | ⭐⭐⭐⭐⭐ | ⭐⭐⭐⭐ | Most common use cases |
| label_wrap() | scales | ⭐⭐⭐⭐ | ⭐⭐⭐⭐⭐ | Complex scaling scenarios |
| Custom function | stringr | ⭐⭐⭐ | ⭐⭐⭐⭐⭐ | Specific business logic |
| Manual breaks | None | ⭐⭐ | ⭐⭐ | Full control, small datasets |
Explore the Complete ggplot2 Guide
35+ tutorials with code: scatterplots, boxplots, themes, annotations, facets, and more—tested and beginner-friendly.
Visit the ggplot2 Hub → No fluff—just code and visuals.