In this tutorial, we will learn how to wrap really long axis tick labels into multiple lines in R while making plots with ggplot2. A long axis text labels make harder to understand the plot and ofter it overlaps with the neighboring labels and obscuring the labels. Here we will see two different ways to wrap long axis labels into multiple ways. First, we will use stringr’s str_wrap() function and then use scales’s label_wrap() function to wrap the labels by specifying a width.
First, let us load tidyverse suit of R packages.
library(tidyverse)
theme_set(theme_bw(18))
To make a simple barplot with really long axis tick labels, let us create a simple dataframe using tibble() function.
df <- tibble(label_grp = c("short", "Medium label",
                          "a very long axis label that needs to be folded"),
              some_value = c(13633,20824,42000)
)
Our data for barplot looks like this.
df

## # A tibble: 3 × 2
##   label_grp                                      some_value
##   <chr>                                               <dbl>
## 1 short                                               13633
## 2 Medium label                                        20824
## 3 a very long axis label that needs to be folded      42000
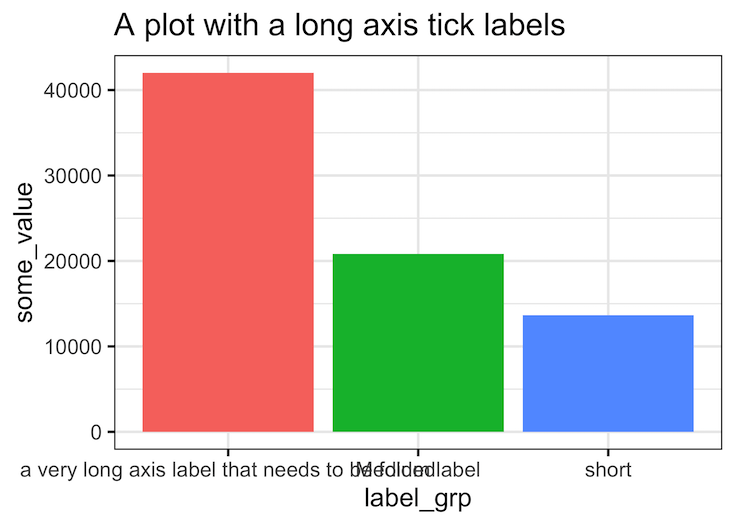
If we make a barplot, we can see that a really long axis tick label overlaps with the next label.
df %>%
  ggplot(aes(x = label_grp,
             y = some_value,
             fill = label_grp))+
  geom_col()+
  theme(legend.position = "none")+
  labs(title="A plot with a long axis tick labels")
Wrapping long labels into multiple lines with stringr::str_wrap() function
Let us use str_wrap() function in stringr R package to specify the width of the label text. We specify labels argument to scale_x_discrete() with a function that wraps the label text to the width we like. In this example we use width of 15 characters.
df %>%
  ggplot(aes(x=label_grp, y=some_value,
             fill=label_grp))+
  geom_col()+
  scale_x_discrete(labels = function(x)
    stringr::str_wrap(x, width = 15))+
  theme(legend.position = "none")
ggsave("wrap_long_axis_tick_labels_into_multiple_lines_R.png")
Now the we call see that all label texts greater than the width of 15 chars is wrapped into two or more lines.

Wrapping long labels into multiple lines with stringr::str_wrap() function with axis flipped
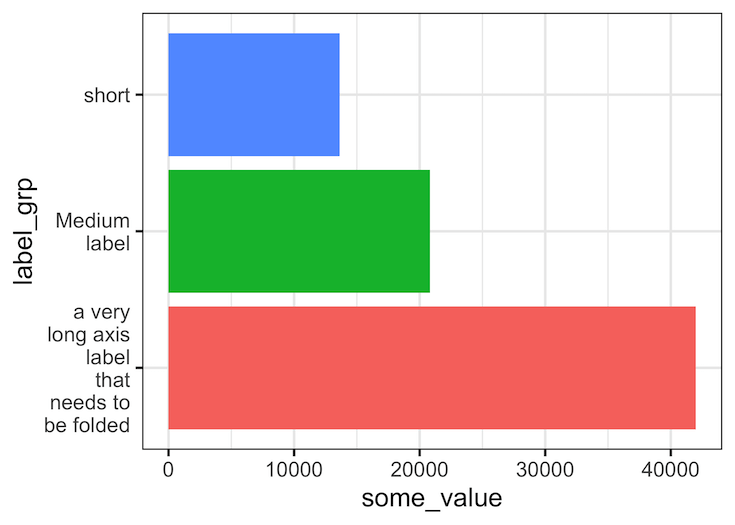
In this example, in addition to wrapping long axis labels into multiple lines, we also flip the axes to make reading the labels easier.
df %>%
  ggplot(aes(y=label_grp, x=some_value,
             fill=label_grp))+
  geom_col()+
  scale_y_discrete(labels = function(x) str_wrap(x, width = 15))+
  theme(legend.position = "none")
ggsave("how_to_wrap_long_axis_tick_labels_into_multiple_lines_R.png")

Wrapping long axis tick labels across multiple lines with scales::label_wrap()
Another easier way to wrap long labels to multiple lines is to use scales package’s function label_wrap(). With label_wrap() we don’t have to write a function as before, instead we just provide the width we need as argument.
df %>%
  ggplot(aes(y = label_grp,
             x = some_value,
             fill = label_grp))+
  geom_col()+
  scale_y_discrete(labels = scales::label_wrap(10))+
  theme(legend.position = "none")

ggsave("wrap_long_labels_across_multiple_lines_with_scales_label_wrap.png")