
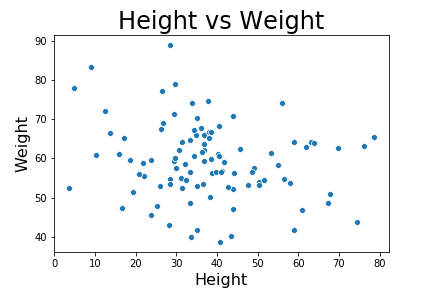
In this post we will see examples of how to change axis labels, how to increase the size of axis labels and how to set title for the plot made using Seaborn in Python. These three are most basic customizations a plot needs to make it useful. Let us load the packages we need to… Continue reading Change Axis Labels, Set Title and Figure Size to Plots with Seaborn
Category: Python
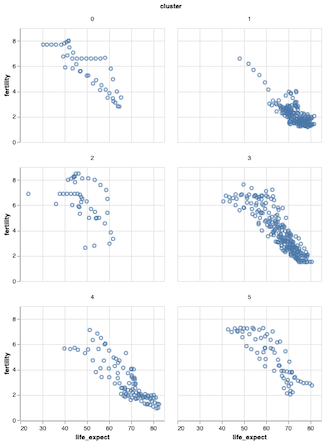
How to Make Pairplot with Seaborn in Python?


When you have multiple variables you might want to quickly look at how each variable is distributed and how each variable is related to other variables. Basically, we are interested in histograms of each variable and scatter plots for all pairs of variables. Seaborn’s pairplot enables us to make such a plot containing a matrix… Continue reading How to Make Pairplot with Seaborn in Python?
How To Facet a Scatter Plot with Altair?

Faceting is a great technique to simplify a complex visualization. Faceting splits a single plot into multiple smaller plots containing subset of data corresponding to a group. This tutorial we will see an example of how to facet a scatter plot with Altair in Python. Let us first load the packages needed to use Altair… Continue reading How To Facet a Scatter Plot with Altair?
Coloring Boxplots with Seaborn Palettes

Boxplots made with Seaborn automatically gets colors by default. Sometimes you might want to change and assign different colors to the boxes in the boxplot. For example, one might want to color boxplots with colors that are colorblind friendly. One great solution to color the boxes in boxplot is to use many of the available… Continue reading Coloring Boxplots with Seaborn Palettes
Horizontal Boxplots with Seaborn in Python
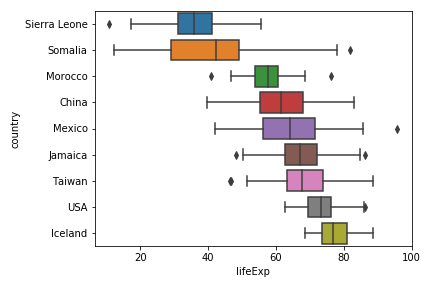
Horizontal boxplots cane be very useful, when you have categories with longer names. In general, Boxplots are great visualization tool for looking at multiple distributions at the same time, However, when the description of each distribution on x-axis is bit longer, it may become really difficult to understand the boxplot. One of the solutions is… Continue reading Horizontal Boxplots with Seaborn in Python