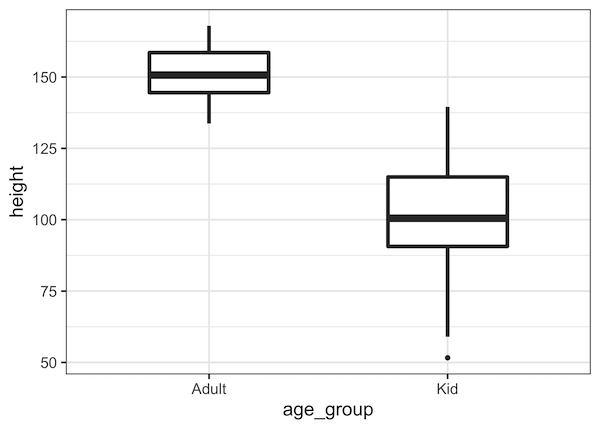
A boxplot is one of the simplest ways to summarize and visualize a distribution. Boxplots have been around for close to 50 years. The earliest form of Boxplot was invented by Mary Eleanor Spear as range plot and then John Tukey created box-and-whisker plot that uses quartiles of a distribution draw a box and whiskers.… Continue reading How to Make Boxplots with ggplot2 in R?
Author: datavizpyr
Coloring Boxplots with Seaborn Palettes
Boxplots made with Seaborn automatically gets colors by default. Sometimes you might want to change and assign different colors to the boxes in the boxplot. For example, one might want to color boxplots with colors that are colorblind friendly. One great solution to color the boxes in boxplot is to use many of the available… Continue reading Coloring Boxplots with Seaborn Palettes
Horizontal Boxplots with Seaborn in Python
Horizontal boxplots cane be very useful, when you have categories with longer names. In general, Boxplots are great visualization tool for looking at multiple distributions at the same time, However, when the description of each distribution on x-axis is bit longer, it may become really difficult to understand the boxplot. One of the solutions is… Continue reading Horizontal Boxplots with Seaborn in Python
Simple Scatter Plot with Matplotlib in Python
Matplotlib is one of the most popular plotting libraries in Python. As the name kind of hints, Matplotlib is bases on MATLAB style interface offers powerful functions to make versatile plots with Python. In this post, we will see examples of simple scatter plot with Matplotlib’s module pyplot. Let us first load the libraries needed.… Continue reading Simple Scatter Plot with Matplotlib in Python
Scatter Plot with Regression Line using Altair in Python
Adding regression line to scatter plot is a great way to understand the relationship between two numeric variables. In this post, we will see an example of using Altair to make a scatter plot with regression line using real world dataset. Let us load the packages we need. We will load Altair package and load… Continue reading Scatter Plot with Regression Line using Altair in Python
