
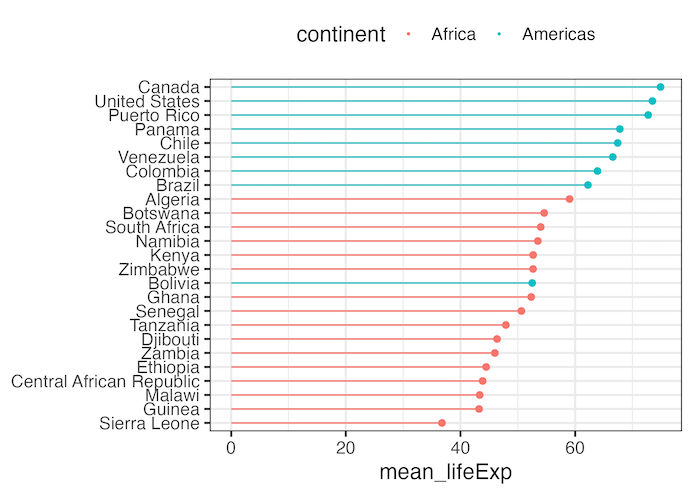
Creating a lollipop plot with ggalt is an excellent way to visualize ranked data with minimal ink usage compared to traditional bar charts. The ggalt package extends ggplot2 functionality with geom_lollipop(), making it easy to create elegant stick-and-circle visualizations that are both space-efficient and visually appealing. In this comprehensive lollipop plot ggalt tutorial, you’ll learn… Continue reading Lollipop plot with ggplot extension ggalt