
Raincloud plot is another interesting use of Violinplots. Rain cloud plot is basically a combination of horizontal half violin plots with jittered data points. We will see step-by-step examples of how to make raincloud plot in this tutorial in R with ggplot2.
Since there is no special function available for half violinplot in ggplot2, we will rely on @drob’s gist containing a function to make half violinplot. Let us first load tidyverse and set the theme for making half violinplots.
library(tidyverse)
theme_set(theme_bw(16))
We have slightly modified (fixed a small typo as suggested by a comment in the gist) the function @drob wrote and have it available at datavizpyr.com’s github account.
source("https://raw.githubusercontent.com/datavizpyr/data/master/half_flat_violinplot.R")
We will use our favorite Penguin dataset to make rain cloud plots with half violin plots.
p2data <- "https://raw.githubusercontent.com/datavizpyr/data/master/palmer_penguin_species.tsv"
penguins_df <- read_tsv(p2data)
## Parsed with column specification:
## cols(
##   species = col_character(),
##   island = col_character(),
##   culmen_length_mm = col_double(),
##   culmen_depth_mm = col_double(),
##   flipper_length_mm = col_double(),
##   body_mass_g = col_double(),
##   sex = col_character()
## )
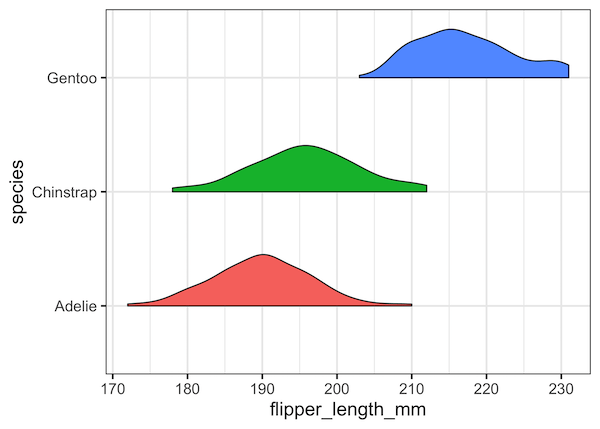
Horizontal Half Violin Plots
Let us first get started with horizontal half violin plots using geom_flat_violin() function.
ggplot(penguins_df, aes(species,
                       flipper_length_mm,
                       fill=species)) +
    geom_flat_violin() +
    coord_flip()+
    theme(legend.position="none")

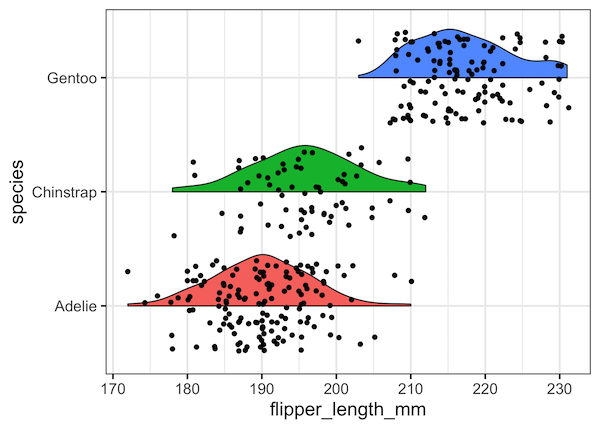
Horizontal Half Violin Plots with jittered data points
Horizontal half violin plot does look like clouds, to add rain to it, we will try to show the data as jittered points. Naively, let us add the geom_jitter() as another layer to the plot.
ggplot(penguins_df, aes(species,
                        flipper_length_mm,
                         fill=species)) +
    geom_flat_violin() +
    coord_flip()+
    geom_jitter()+
    theme(legend.position="none")
Our first try at making raincloud plot is not successful as the jittered data points is all over the half violin plot.
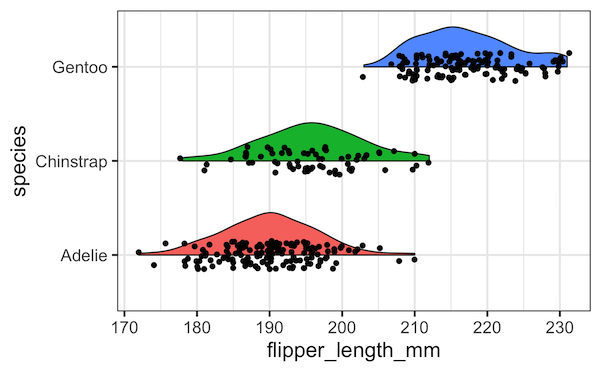
Let us improve the raincloud by restricting the width of jittered data points.
ggplot(penguins_df, aes(species,
                        flipper_length_mm,
                         fill=species)) +
    geom_flat_violin() +
    coord_flip()+
    geom_jitter(width=0.15)+
    theme(legend.position="none")
Our second try at making rain cloud plots does look better than the first try.
Rain Cloud plots: Combining Horizontal Half Violin Plots with jittered data points
Ideally we need to separate the half violin plot from the jittered data points. We can move the position of the half violinplot using position argument in ggplot2. Here, we use position_nudge() function with specific value on x and y axis to move the half violin plot in one direction.
ggplot(penguins_df, aes(species,flipper_length_mm, fill=species)) +
    geom_flat_violin(position = position_nudge(x = .2, y = 0)) +
    coord_flip()+
    geom_jitter(width=0.15)+
    theme(legend.position="none")
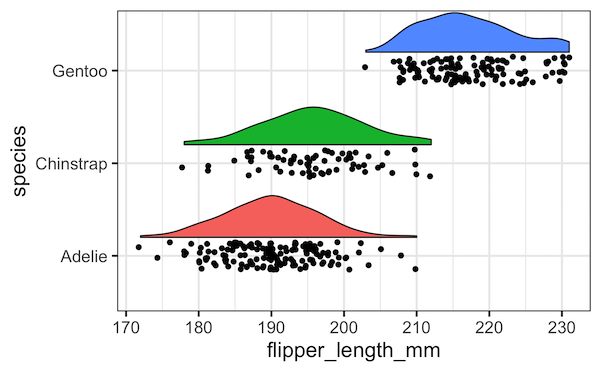
Hurray! We have made the raincloud plot successfully. Now let us add colors to jittered data points using aes() within geom_jitter().
ggplot(penguins_df, aes(species,flipper_length_mm, fill=species)) +
    geom_flat_violin(position = position_nudge(x = .2, y = 0)) +
    coord_flip()+
    geom_jitter(aes(color = species),
                width=0.15, alpha = 0.6)+
    theme(legend.position="none")
Now we have a much better looking raincloud plot.


