


Let us load ggforce and tidyverse suita of R packages.
library(ggforce)
library(tidyverse)
theme_set(theme_bw(16))
To illustrate how to make a plot with zoom in using ggplot2, we will use astronauts dataset from TidyTuesday project. Let us load the astronauts data from TidyTuesday project’s github.
# Load data from TidyTuesday github
astronauts <- readr::read_csv('https://raw.githubusercontent.com/rfordatascience/tidytuesday/master/data/2020/2020-07-14/astronauts.csv')
This data set contains details about astronauts who went to space starting form 1960s.
## Parsed with column specification:
## cols(
##   .default = col_double(),
##   name = col_character(),
##   original_name = col_character(),
##   sex = col_character(),
##   nationality = col_character(),
##   military_civilian = col_character(),
##   selection = col_character(),
##   occupation = col_character(),
##   mission_title = col_character(),
##   ascend_shuttle = col_character(),
##   in_orbit = col_character(),
##   descend_shuttle = col_character()
## )
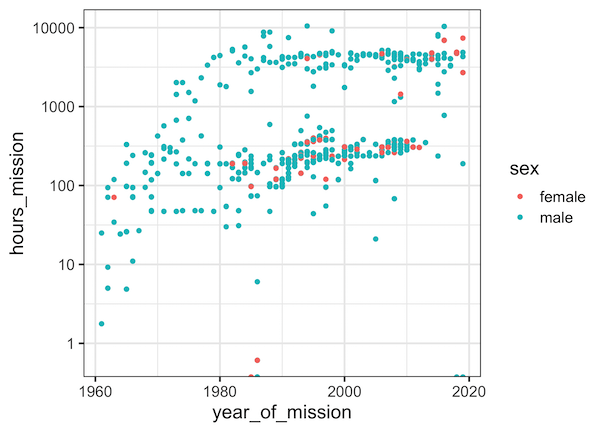
Let us make a simple scatterplot between the year of space mission and hours of mission for each astronauts. Since the range of y=axis is large, we use log scale in the scatter plot.
astronauts %>%
  ggplot(aes(x=year_of_mission,hours_mission, color=sex))+
  geom_point()+
  scale_y_log10()
In this example, we can see an interesting pattern around 1980, where some missions are shorter in time, while the other is longer. Having the ability to zoom in on the year around this transition may be useful.

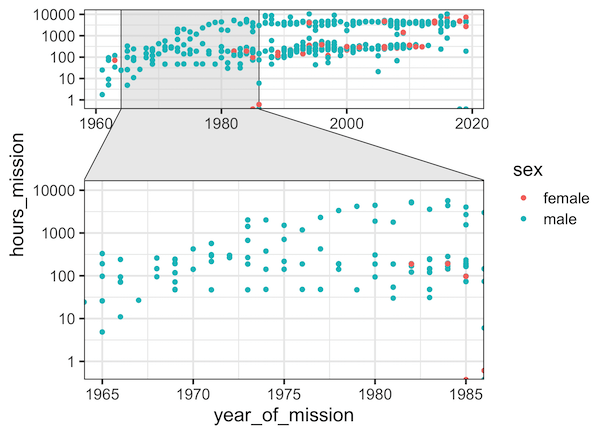
ggforce, one of the ggplot2 extension packages lets you zoom in to ggplot2 in multiple ways. Here we use ggforce’ facet_zoom() function to zoom in on part of x-axis with a specific range provided as argument.
astronauts %>%
  ggplot(aes(x=year_of_mission,hours_mission, color=sex))+
  geom_point()+
  scale_y_log10()+
  facet_zoom(xlim = c(1965, 1985))
ggforce’s facet_zoom() creates faceted plot with the original plot first and an inset showing the zoomed in region as shown below.
Explore the Complete ggplot2 Guide
35+ tutorials with code: scatterplots, boxplots, themes, annotations, facets, and more—tested and beginner-friendly.
Visit the ggplot2 Hub → No fluff—just code and visuals.


