
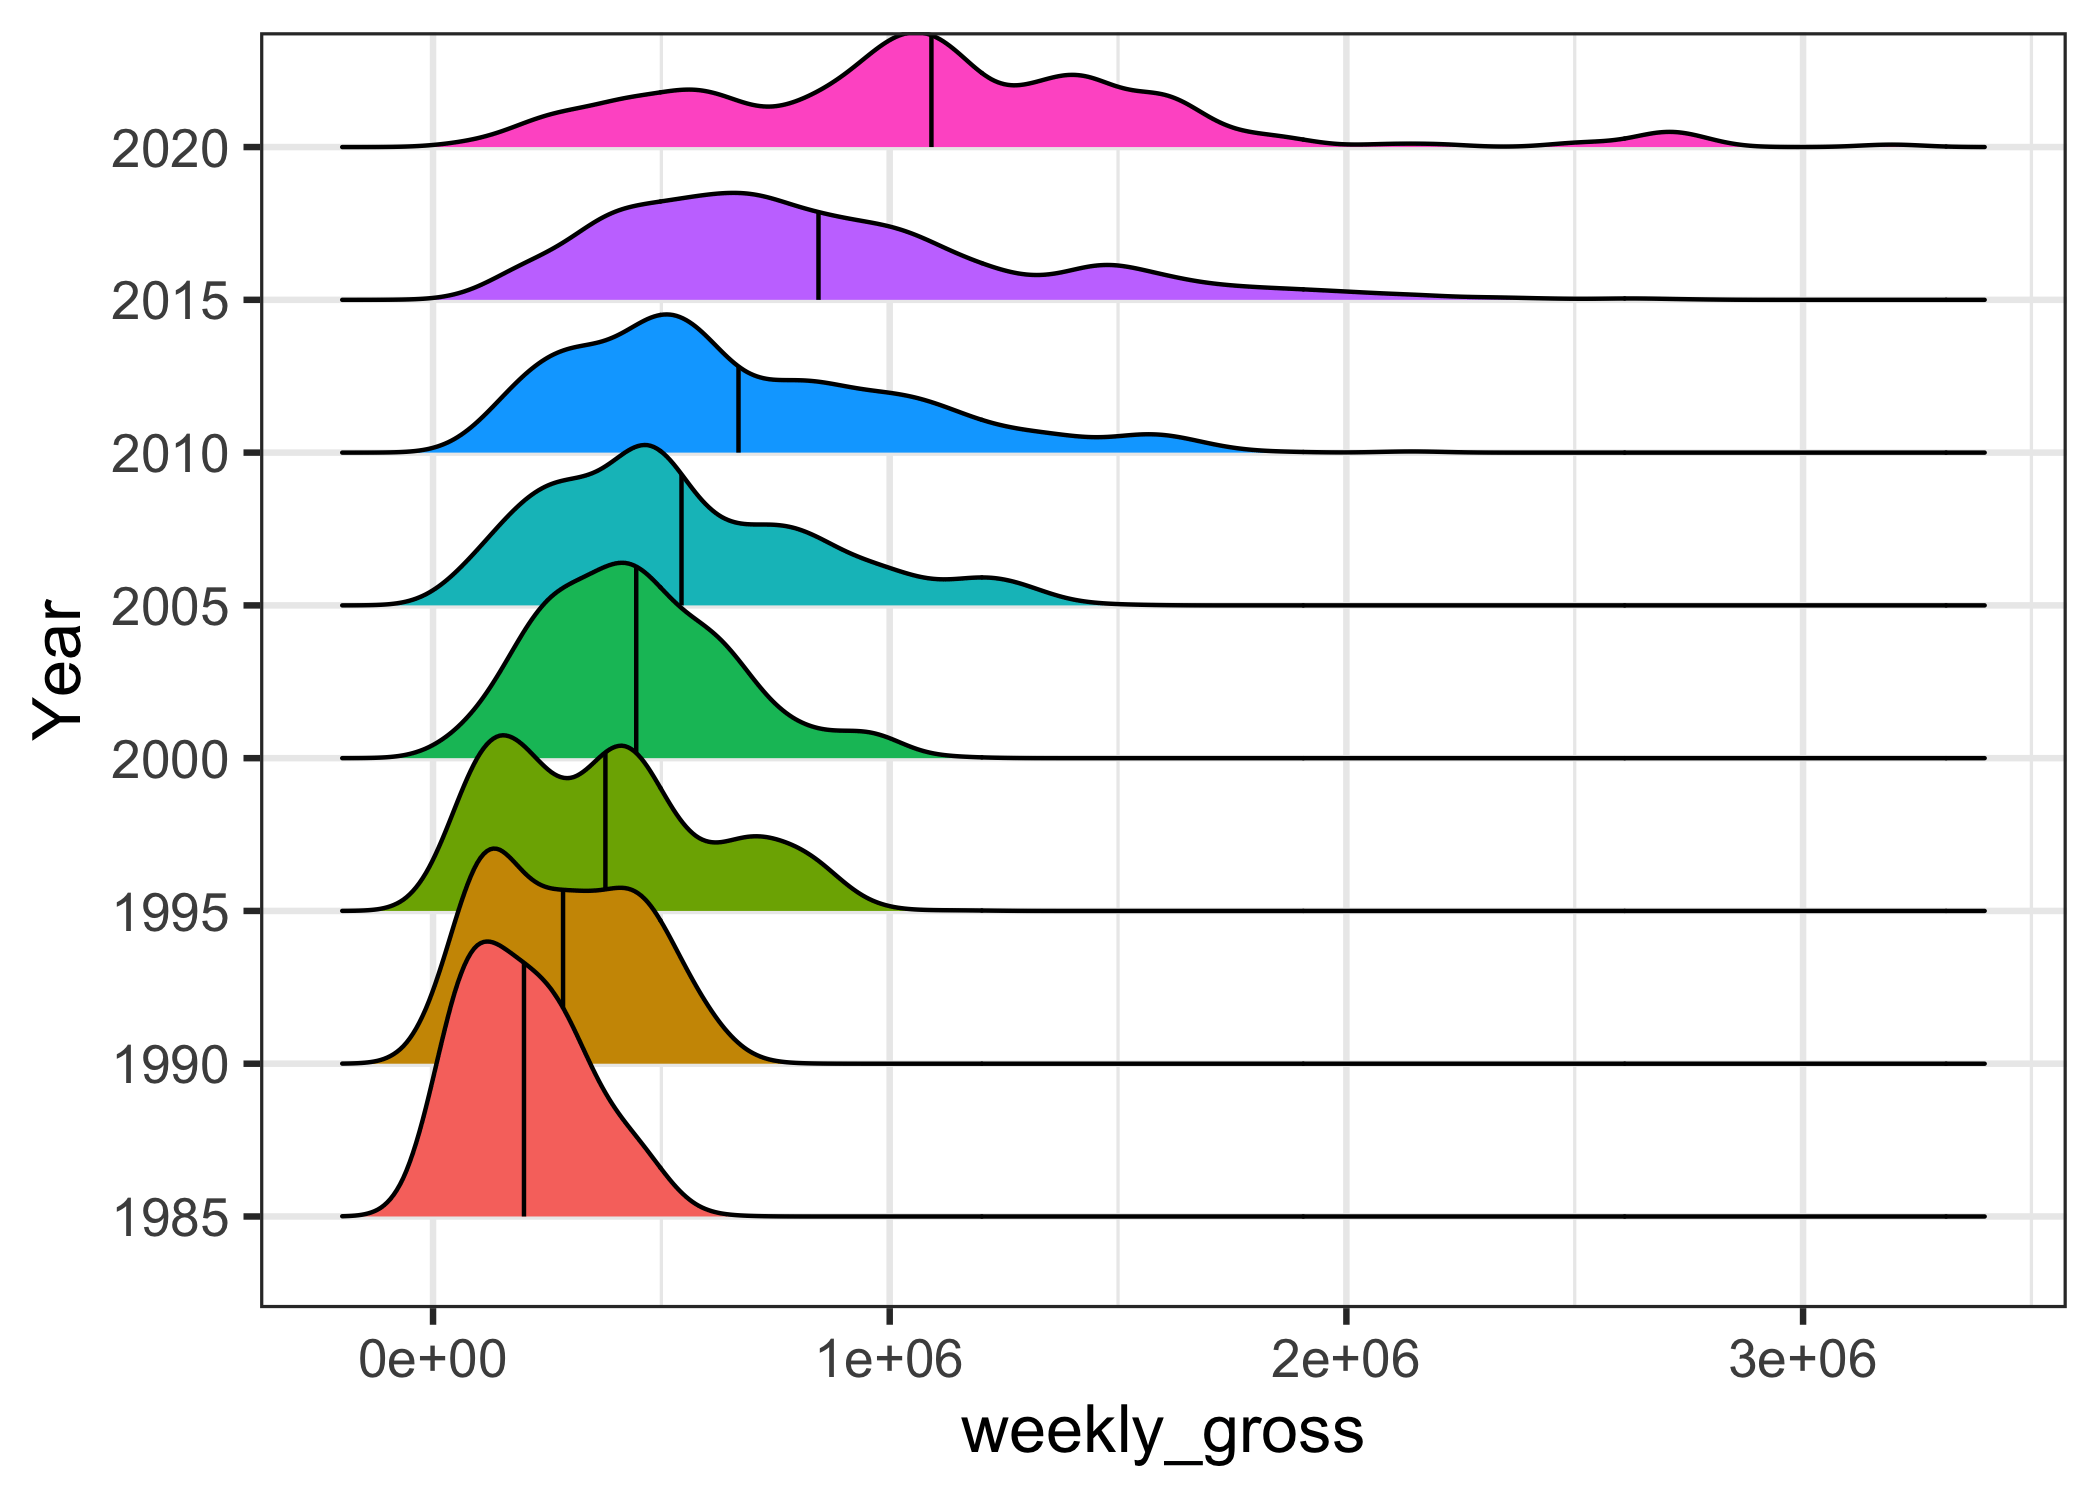
In this post, we will learn how to add mean line to ridgeline plot. We can make ridgeline plot in R with ggridges R package developed Claus Wilke. Ridgeline plot is useful when you have multiple distributions or a distribution that changes in distributions over time or space. The name “ridgeline” comes from the way… Continue reading How To Add Mean Line to Ridgeline Plot in R with ggridges?
Category: Ridgeline Plot ggridges
How To Make Ridgeline Plot with ggridges in R?

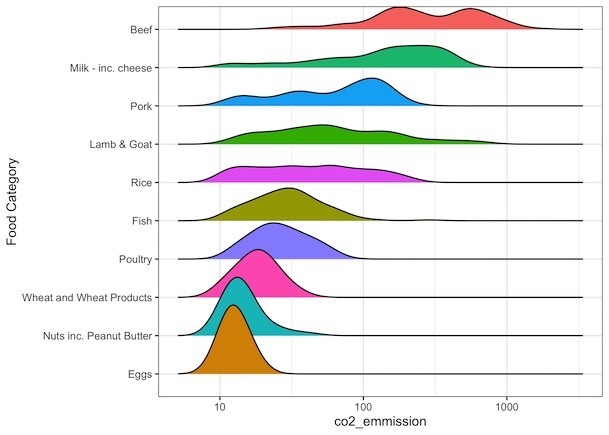
Ridgeline plot is one of the data visualization techniques that is suitable for visualizing multiple distributions or changes in distributions over time or space. Claus Wilke made created this plot and a package in R to make this easily. He defines it as a partially overlapping line plots that create the impression of a mountain… Continue reading How To Make Ridgeline Plot with ggridges in R?