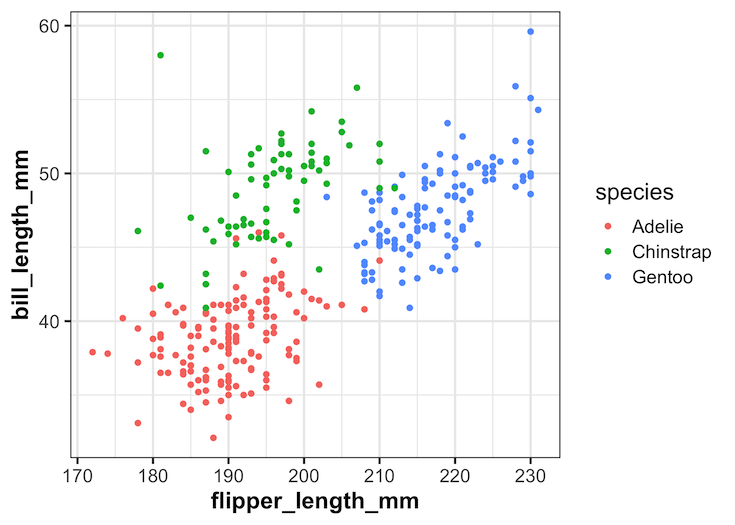
In this tutorial, we will learn how to change the axis title bold font with ggplot2 in R. Let us load the packages needed including tidyverse and palmerpenguins for penguins data. A plot with default font for axis title text Let us make a simple scatter plot using ggplot2 to see how the default font… Continue reading How to Make Axis Title Bold Font with ggplot2
Category: R
How to Make Axis Text Bold in ggplot2
In this tutorial, we will learn how to make the axis text bold in a plot made with ggplot2 in R. Axis text in a plot refers to the text annotating the tick marks on x and y-axis. By default the axis text around tick marks are not in bold font and here we will… Continue reading How to Make Axis Text Bold in ggplot2
Pair plot from scratch with tidyverse
Pair plot is a simple way to quickly visualize the relationship between multiple variables in a dataframe. In this post, we will learn how to make a simple pair plot from scratch between a few quantitative/numerical variables using basic tidyverse functions. (H/T to a twitter user who did something very similar to this for the… Continue reading Pair plot from scratch with tidyverse
How to Add Caption to a Plot in R
In this tutorial, we will learn how to add caption to a plot made with ggplot2 in R. Caption in R is a small text at the right corner of a plot that adds some value to the plot. We will use faithful eruption data available from built-in dataset in R. Simple plot with ggplot2… Continue reading How to Add Caption to a Plot in R
How to order boxes in boxplot with fct_reorder in R
In this tutorial, we will learn how to order boxes in boxplot made with ggplot2 in R. There are a few ways to order boxes in a boxplot. Earlier, we saw how to use base R’s reorder() function to order the boxes in boxplot based on the median values of another variable in the data.… Continue reading How to order boxes in boxplot with fct_reorder in R
