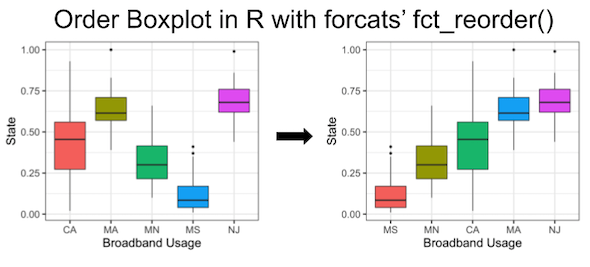
In this tutorial, we will learn how to order boxes in boxplot made with ggplot2 in R. There are a few ways to order boxes in a boxplot. Earlier, we saw how to use base R’s reorder() function to order the boxes in boxplot based on the median values of another variable in the data.
Here, we will learn how to use fct_reorder() function in the useful R package forcats to order boxes in a boxplot by a variable in the data.
Load tidyverse and the data
First, let us load tidyverse suite of R packages and set ggplot2’s theme to theme_bw() with base size 18.
library(tidyverse)
theme_set(theme_bw(18))
We will use broadband usage data from tidytuesday project directly from its github page.
broadband <- readr::read_csv('https://raw.githubusercontent.com/rfordatascience/tidytuesday/master/data/2021/2021-05-11/broadband.csv')
##
## ── Column specification ────────────────────────────────────────────────────────
## cols(
##   ST = col_character(),
##   `COUNTY ID` = col_double(),
##   `COUNTY NAME` = col_character(),
##   `BROADBAND AVAILABILITY PER FCC` = col_character(),
##   `BROADBAND USAGE` = col_character()
## )
Let us cleanup the data and select two columns of interest to make the boxplot.
broadband <- broadband %>%
  mutate("Broadband_Usage"= as.numeric(`BROADBAND USAGE`)) %>%
  select(ST, Broadband_Usage)
Horizontal Boxplot with ggplot2
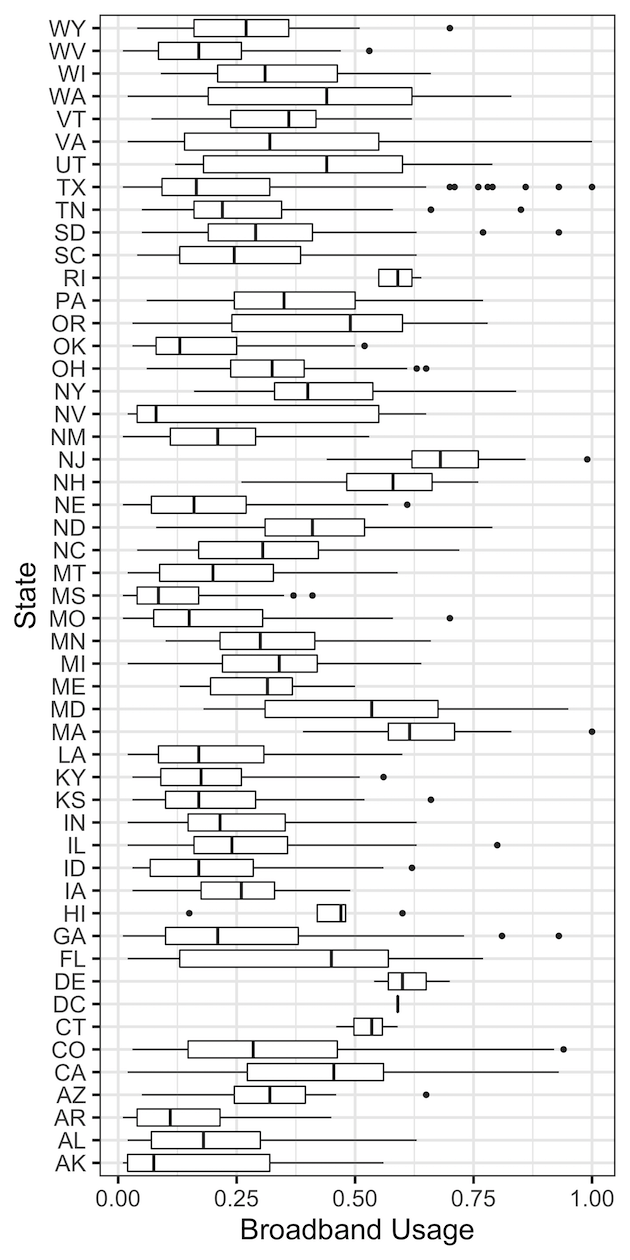
Let us make horizontal boxplot using ggplot. By default, ggplot2 orders boxes, i.e. groups, in alphabetical order when the variable of interest is a character variable. We proceed to make horizontal boxplot using ggplot2 v3.3’s bidirectional axis capability (i.e. without coord_flip() function)
broadband %>%
  ggplot(aes(y=ST, x=Broadband_Usage))+
  geom_boxplot()+
  labs(x="Broadband Usage", y="State")
ggsave("boxplot_with_default_ordering_ggplot2.png", width=6,height=12)
Notice that although horizontal boxplot has made it easier to see all the state’s plots, it is still harder to fully understand the data with un-ordered boxes in the boxplot.

reorder boxplot with fct_reorder()
We can reorder a factor variable based on the values of another numerical variable using forcats’ fct_reorder() function. Here we reorder the factor variable and save it in the dataframe for the sake of simplicity using mutate() function in dplyr.
broadband %>%
  mutate(ST=fct_reorder(ST, Broadband_Usage))%>%
  ggplot(aes(x=Broadband_Usage, y=ST))+
  geom_boxplot()+
  labs(x="Broadband Usage", y="State")
ggsave("ordering_boxes_in_boxplot_with_fct_reorder_first_try_ggplot2.png", width=6,height=12)
Our effort to reorder boxes is not fully successful. Although most of the boxes are in sorted order, there are a few on the top that are not ordered properly.

We might also also notice the error that we get from ggplot2 and it suggests that we have some missing data.

## Warning: Removed 9 rows containing non-finite values (stat_boxplot).
reorder boxplot using fct_reorder() with missing data
We can correctly order the boxplot by removing any missing data. There are a few ways to remove the missing data. In this example, we use fct_reorder()’s argument “na.rm=TRUE” to remove misisng while reordering the factor variable by another numerical variable.
broadband %>%
  drop_na() %>%
  mutate(ST=fct_reorder(ST, Broadband_Usage,
            na.rm=TRUE))%>%
  ggplot(aes(y = ST, x = Broadband_Usage))+
  geom_boxplot()+
  labs(x = "Broadband Usage", y = "State")
ggsave("ordering_boxes_in_boxplot_remove_na_with_fct_reorder_second_try_ggplot2.png", width=6,height=12)
Now we have reordered the boxes in boxplot correctly using fct_reorder() function. Note that fct_reorder() function sorts the boxes by median by default. One can change to different fucntion like mean using “.fun” argument to fct_reorder() function.


reorder boxplot in descending order using fct_reorder()
We can reorder boxes in boxplot in descending order using .desc=TRUE argument to fct_reorder() function.
broadband %>%
  mutate(ST=fct_reorder(ST, Broadband_Usage,
                        na.rm=TRUE,
                        .desc=TRUE)) %>%
  ggplot(aes(y=ST, x=Broadband_Usage))+
  geom_boxplot()+
  labs(x="Broadband Usage", y="State")
ggsave("descending_order_boxes_in_boxplot_na_rm_with_fct_reorder_ggplot2.png",
       width=8, height=12)


Explore the Complete ggplot2 Guide
35+ tutorials with code: scatterplots, boxplots, themes, annotations, facets, and more—tested and beginner-friendly.
Visit the ggplot2 Hub → No fluff—just code and visuals.