
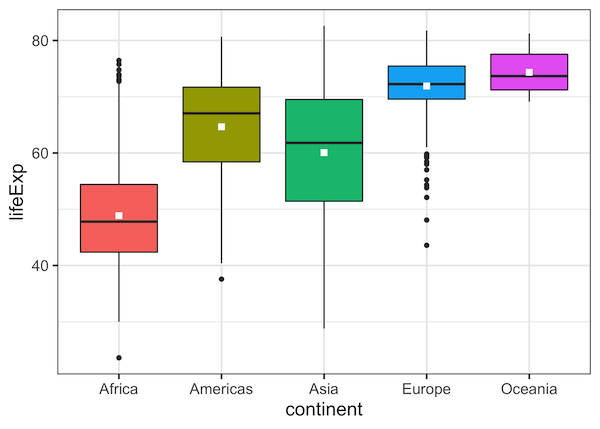
Boxplots are a great way to visualize multiple distributions using summary statistics. Boxplot shows five summary statistics; the minimum, the maximum, the median, and the first and third quartiles of the data. Sometimes, you might want to add other statistical summary values on the boxplot. In this post, we will see how to show mean… Continue reading How To Show Mean Value in Boxplots with ggplot2?