
In this tutorial, we will learn how to wrap a really long labels in a facet plot made with ggplot2 using facet_wrap(). When the facet labels are too long, the label text gets cuts off. Here we will learn how can we fold or wrap the long facet labels into multiple lines so that the facet label is clearly legible.
library(tidyverse)
theme_set(theme_bw(16))
First, let us simulate some toy dataset with a long text labels. In this dataset below, we have two groups and one of them is really long text and the other is small.
df <- tibble(values = rnorm(500, mean=5, sd=10),
             grp = c(rep("group A", 250),
                     rep("a really long named group that needs to be wrapped", 250))
             )
df %>% head()

# A tibble: 6 × 2
  values grp
   <dbl> <chr>
1 -6.43  group A
2 -9.42  group A
3  7.42  group A
4  3.23  group A
5  0.996 group A
6 -4.39  group A
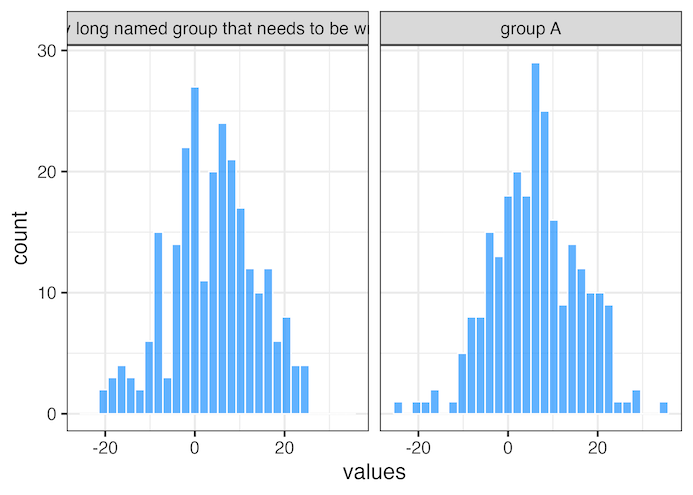
Let us make simple histogram for each group we have separately using facet_wrap() function in ggplot2.
df %>%
  ggplot(aes(x=values))+
  geom_histogram(bins=30,
                 alpha=0.7,
                 color="white",
                 fill="dodgerblue")+
  facet_wrap(~grp)
ggsave("facet_wrap_plot_with_long_labels.png")
Since one of the group name, a facet label, is too long, it is cut short.
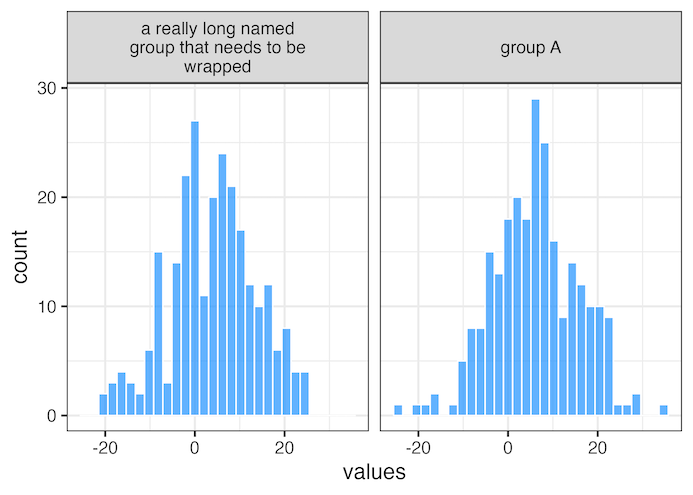
We can wrap the facet labels into multiple lines by specifying a width using labeller argument to facet_wrap() function. The labeller argument takes labeller() function where we specify the facet label width to 25 using label_wrap_gen() function.
df %>%
  ggplot(aes(x=values))+
  geom_histogram(bins=30, alpha=0.7,
                 color="white",
                 fill="dodgerblue")+
  facet_wrap(~grp,
             labeller = labeller(grp = label_wrap_gen(width = 25)))
  ggsave("how_to_wrap_long_labels_facets_wrap.png")
Now our facet plot looks much better with the long facet label nicely wrapped in multiple lines.
You might also want to see other related posts to help make axis labels legible
- How To Rotate x-axis Text Labels in ggplot2
- How To Avoid Overlapping Labels in ggplot2?
- How to wrap long axis tick labels into multiple lines in ggplot2
Explore the Complete ggplot2 Guide
35+ tutorials with code: scatterplots, boxplots, themes, annotations, facets, and more—tested and beginner-friendly.
Visit the ggplot2 Hub → No fluff—just code and visuals.


