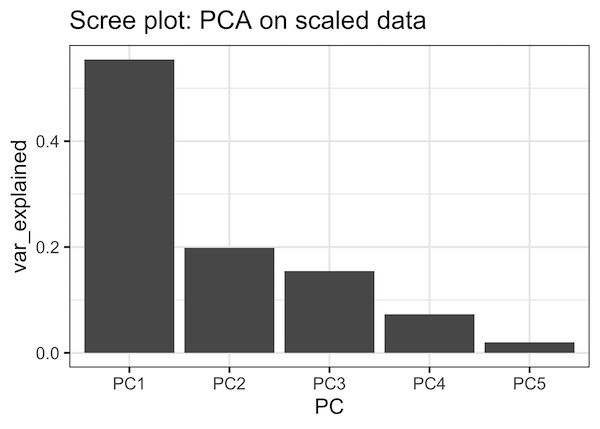
PCA aka Principal Component analysis is one of the most commonly used unsupervised learning techniques in Machine Learning. PCA on a high dimensional data can reveal the pattern or structure in the data. Scree plot is one of the diagnostic tools associated with PCA and help us understand the data better. Scree plot is basically… Continue reading How To Make Scree Plot in R with ggplot2
