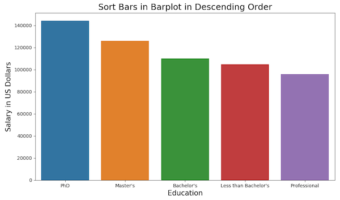
Barplots are a great way to visualize the relationship between categorical variables and their corresponding quantitative values. However, the default order of categories in Seaborn is often alphabetical, which may not be meaningful. Sorting the bars makes comparisons easier and … [Read more...] about How To Order Bars in Barplot using Seaborn in Python?
Python
How To Make Stripplot using Seaborn Catplot?
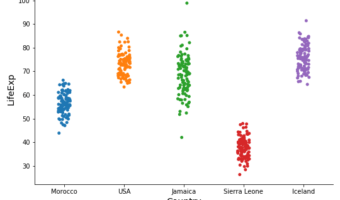
Stripplots are like scatter plots but one of the variables is a categorical variable. Stripplots are a great addition to boxplots as it shows complete data on the plot. Stripplots are more useful when can add random noise called "jitter" to avoid overlapping of data points with … [Read more...] about How To Make Stripplot using Seaborn Catplot?
How To Highlight a Bar in Bar Chart in Altair?
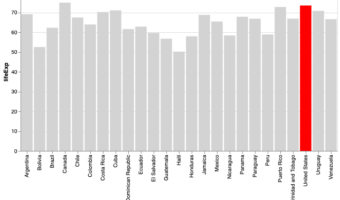
Bar charts are a simple visualization that plots a quantitative variable corresponding to categorical variable as bars. Sometimes we might want to highlight a specific bar in barplot with different color compared to the rest. In this post, we will see examples of * How to Make a … [Read more...] about How To Highlight a Bar in Bar Chart in Altair?
Hierarchically-clustered Heatmap in Python with Seaborn Clustermap

In this post, we will learn how to make hierarchically clustered heatmap in Python. We will use Saeborn's Clustermap function to make a heat map with hierarchical clusters. Seaborn's Clustermap is very versatile function, but we will showcase the use of the function with just one … [Read more...] about Hierarchically-clustered Heatmap in Python with Seaborn Clustermap
How To Make Ridgeline plot in Python with Seaborn?

Ridgeline plots are great to visualize numerical distributions corresponding to multiple groups or categorical variables. Ridgeline plots make density plots or histograms for each group one on top of each other and thus making it look like "a mountain range". They are great for … [Read more...] about How To Make Ridgeline plot in Python with Seaborn?