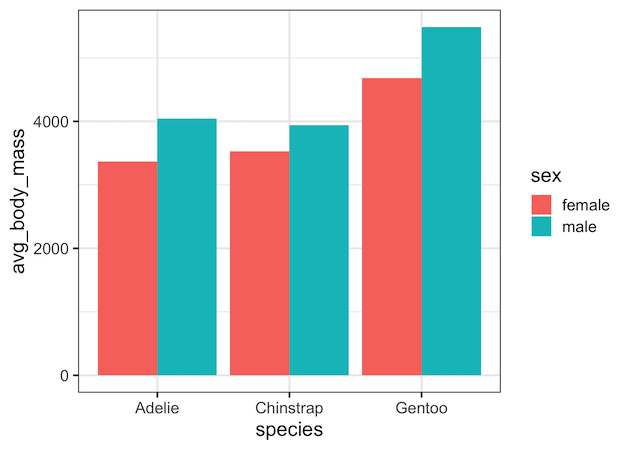
When you have dataset with two categorical variables and one quantitative variable, a grouped barplot is a great way to see the relationship among the variable. In a simple barplot, we have categorical variable on x-axis and have bars showing the numerical value of the quantitative variable. In a grouped barplot, we add the third… Continue reading How to Make Grouped/Stacked Barplot in R?
