
In this post, we will learn how to make a scatterplot with marginal boxplots using Seaborn in Python. To make a scatterplot we will use some of Seaborn’s powerful but not very well known functionalities. More specifically, we will use Seaborn’s JointGrid() to set up the plot features and then add two layers of plots. First we will add scatter plot and then we will add boxplot on the marginals.
First, let us load the libraries needed.
👉 Want more? Explore the full Seaborn Tutorial Hub with 35+ examples, code recipes, and best practices.
import matplotlib.pyplot as plt
import pandas as pd
import seaborn as sns
We will load Penguins data directly from the github.
penguins_data="https://raw.githubusercontent.com/datavizpyr/data/master/palmer_penguin_species.tsv"
penguins_df = pd.read_csv(penguins_data, sep="\t")
penguins_df.head()
Seaborn’s JointGrid help us create “Grid for drawing a bivariate plot with marginal univariate plots.”. It helps build layers of plot. At first, we will use JointGrid() with data and x and y-axis we want to use. This simply creates an empty plot as shown below.
# set plot context to set plot sizes
sns.set_context("talk", font_scale=1.2)
plt.figure(figsize=(12,10))
g = sns.JointGrid(data=penguins_df,
                  x="culmen_length_mm",
                  y="culmen_depth_mm")
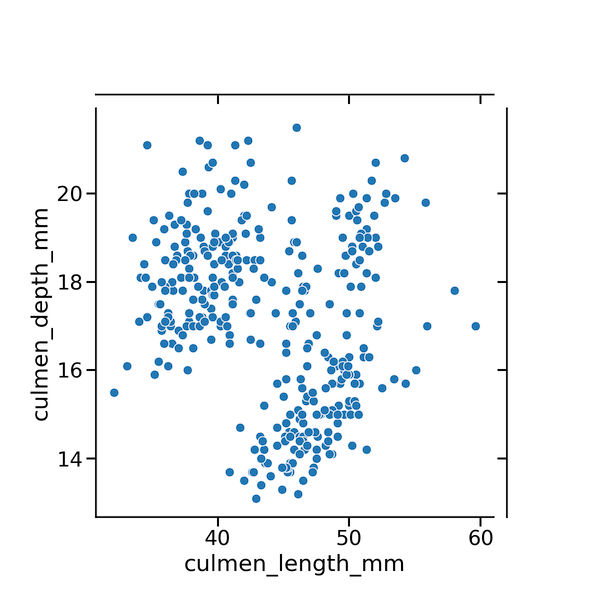
Now we can add layers of plots over the JointGrid() plot. Here we use Seaborn’s plot_joint() function to make scatter plot. TO do that, we call Seaborn’s scatterplot() as argument to plot_joint().
g.plot_joint(sns.scatterplot)
Since we have already specified the data and x and y-axis using JointGrid(), it is enough to specify the scatterplot function name and this makes a simple scatterplot.
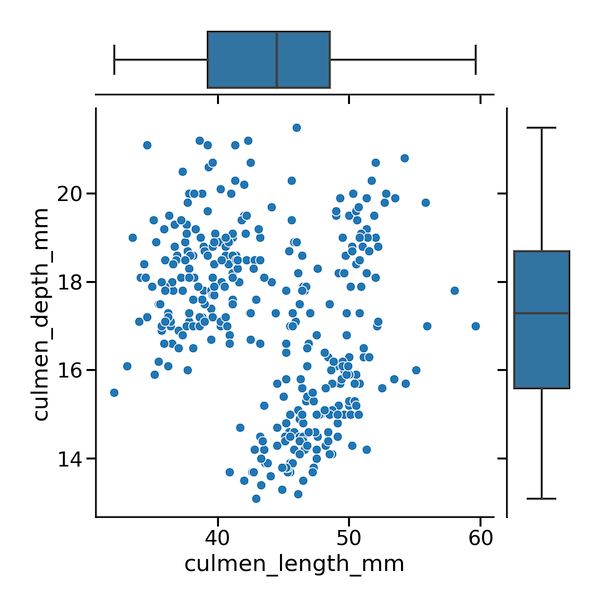
We can then add the marginal boxplots using plot_marginals() function with Seaborn’s boxplot() function as argument.
g.plot_joint(sns.scatterplot)
g.plot_marginals(sns.boxplot)
plt.savefig("Scatterplot_with_marginal_boxplot_Seaborn.png",
                    format='png',dpi=150)
Now we get scatterplot with boxplot along the marginals with Seaborn.


1 comment
Comments are closed.