In this post, we will learn how to remove a legend from a plot made with ggplot2 in R. There are a few ways to remove legend in ggplot2. We will see examples using two functions in ggplot2 to remove legend from a plot. We will first use theme() function to remove legend in ggplot2 and then see an example using guides() function to remove legend.
Load tidyverse and data
First, let us load tidyverse and gapminder package to make a plot using ggplot2 with legend. Let us also choose ggplot2 theme to theme_bw() and this mainly will change background color to white from default grey.
library(gapminder)
library(tidyverse)
theme_set(theme_bw(base_size = 16))
Simple plot with legend in ggplot2
When you make a plot with ggplot2, it adds a legend automatically when you use three variables in aes() function in a plot. Typically, the first two variables will be x and y axis and the third variable can be fill, color, shape, or size. Sometimes having a legend cane be redundant and you might want to remove legend.
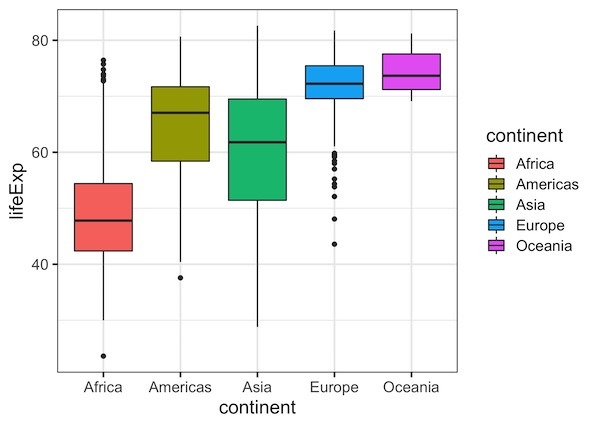
Let us make a boxplot using ggplot2 and fill the boxes by a variable. This adds a legend automatically.
gapminder %>%
  ggplot(aes(x=continent, y=lifeExp, fill=continent)) +
  geom_boxplot()

How To Remove Legend in ggplot using theme()
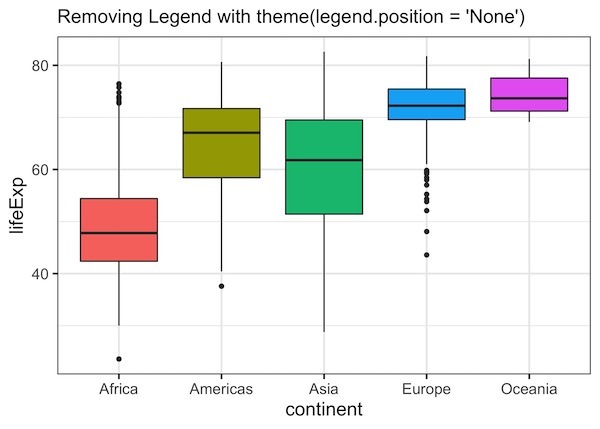
We can see that in the above boxplot, the legend is on the right hand side of the plot and it is redundant as it gives the same information on the x-axis. We can improve the plot by removing the legend from the plot. One of the ways to remove legend from ggplot2 is to use theme() function as another layer with argument legend.position = “None”.
gapminder %>%
  ggplot(aes(x=continent, y=lifeExp, fill=continent)) +
  geom_boxplot() +
  # remove legend with theme()
  theme(legend.position = "None")+
  labs(subtitle="Removing Legend with theme(legend.position = 'None')")
How To Remove Legend in ggplot2 using guides()
Another way to remove legend from ggplot2 is to use guides() function with specific argument depending on the type of ggplot2.
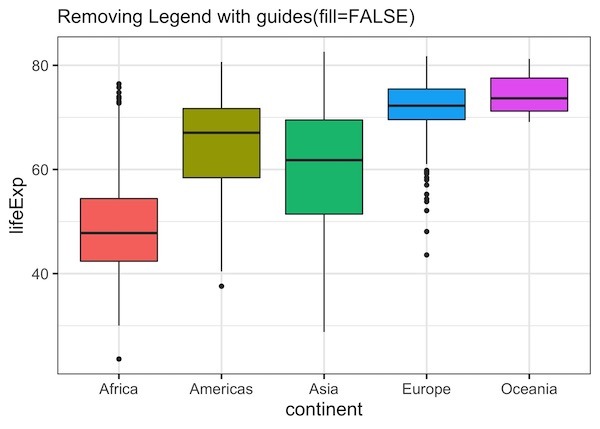
For example, if we make a boxplot with fill argument, we use “guides(fill=FALSE)” to remove legend.
gapminder %>%
  ggplot(aes(x=continent, y=lifeExp, fill=continent)) +
  geom_boxplot() +
  # remove legend using guides()
  guides(fill=FALSE)+
  labs(subtitle="Removing Legend with guides(fill=FALSE)")
Similarly, if we have a boxplot with color argument, we use “guides(color=FALSE)” to remove legend.
gapminder %>%
  ggplot(aes(x=continent, y=lifeExp, color=continent)) +
  geom_boxplot() +
  guides(color=FALSE)
Note the advantage of using theme(legend.position = “None”) is that it can remove legend irrespective of the type of ggplot2.
gapminder %>%
  ggplot(aes(x=continent, y=lifeExp, color=continent)) +
  geom_boxplot() +
  theme(legend.position = "None")
Explore the Complete ggplot2 Guide
35+ tutorials with code: scatterplots, boxplots, themes, annotations, facets, and more—tested and beginner-friendly.
Visit the ggplot2 Hub → No fluff—just code and visuals.