
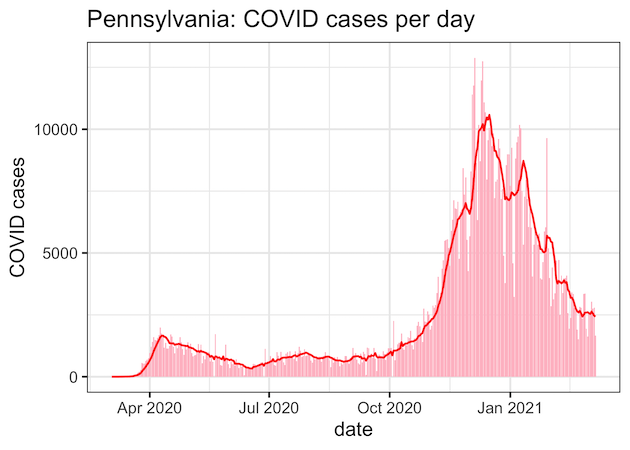
In this post we will learn how to make a time-series plot with a rolling mean using R. Often time-series data fluctuate a lot in short-term and such fluctuations can make it difficult to see the overall pattern in the plot. A solution is to smooth-out the short term fluctuations by computing rolling mean or… Continue reading How to Make Time-Series Plot with Rolling Mean in R?