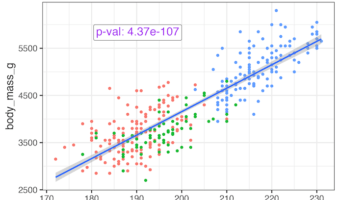
Adding statistical significance indicators to your data visualizations is crucial for communicating research findings effectively. When working with ggplot2 in R, displaying p-values directly on scatter plots helps viewers immediately understand the statistical relationship … [Read more...] about How to Annotate a plot with P-value in ggplot2
R
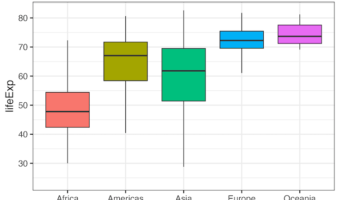
How to order facet variable in grouped boxplot by mean difference between groups in ggplot2

In this tutorial, we’ll dive into grouped boxplots using ggplot2 in R and demonstrate how to reorder facet variables based on the mean difference between groups. Imagine comparing sales performance across multiple regions or test scores across different schools—by reordering … [Read more...] about How to order facet variable in grouped boxplot by mean difference between groups in ggplot2
How to Deal with Outliers in boxplot with ggplot2
In this post, we will learn of two ways to deal with outlier data points while making a boxplot. By default, ggplot2 boxplot() identifies the outliers and disply them as black dots at the boxplot extremes. One of the options to deal with outlier is to ignore them. With ggplot2, … [Read more...] about How to Deal with Outliers in boxplot with ggplot2
How to Move Facet strip label to the bottom
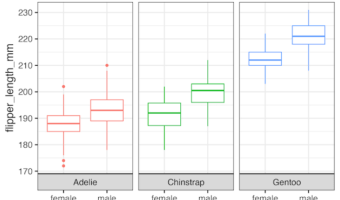
In this tutorial, we will learn how to move the strip label title text in ggplot2's facet* functions to the bottom. By default, facet_wrap() creates a box for each strip with a label at the top of the small multiple plot. In this post, we will show how to move the strip label to … [Read more...] about How to Move Facet strip label to the bottom
4 Ways to have Plots Side by side in ggplot2
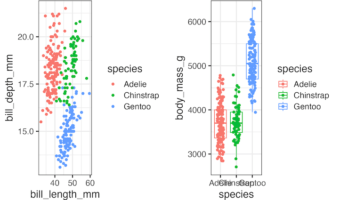
In this post, we will learn how to combine two plots side-by-side using four different approaches. First, we will show how we can use facet_wrap() function in ggplot2, if we are interested in similar plots (small multiples) side by side. Next three approaches are more general, … [Read more...] about 4 Ways to have Plots Side by side in ggplot2