
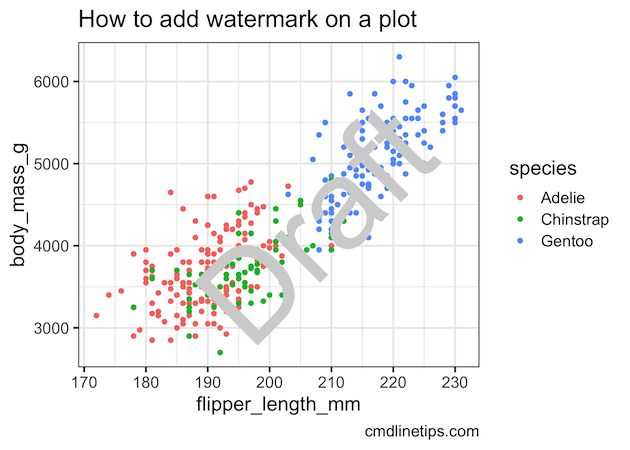
In this tutorial, we will learn how to add water marks to a plot made in R. We will use ggplot2 to make the plot and use the R package cowplot to add water mark on top the plot. The cowplot package developed by Claus Wilke functions to draw with and on plots. These functions… Continue reading How to add water mark on a ggplot
Category: R
How to Reverse and Reorder Facets in ggplot2 (R) with fct_rev, factor, and fct_relevel

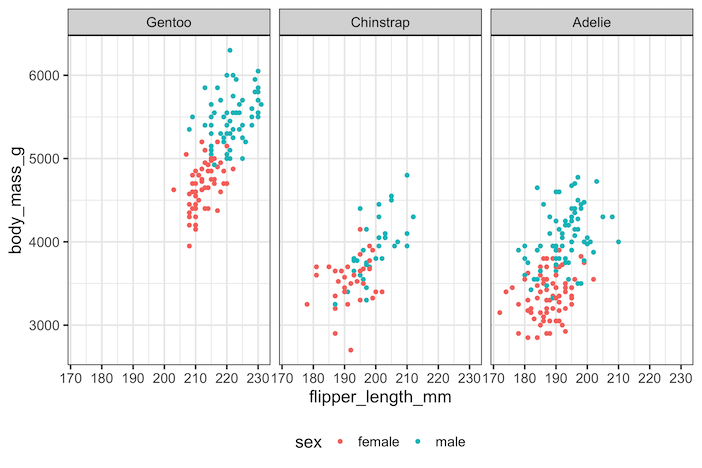
By default, ggplot2 arranges facets in alphabetical order based on the factor levels of the variable you facet by. This behavior is logical but not always useful. Analysts often need to reverse or customize facet order to match reporting requirements, presentation style, or domain conventions. For example, showing “Graduate, Undergraduate, High School” rather than the… Continue reading How to Reverse and Reorder Facets in ggplot2 (R) with fct_rev, factor, and fct_relevel
How to Add Colors to Axis Tick Label in ggplot2


In this tutorial, we will learn how to add colors to axis tick labels in ggplot2. To add colors to axis labels we will use the R package “ggtext: Improved text rendering support for ggplot2” developed by Claus Wilke. Let us get started by loading the packages needed. We will use Palmer Penguin data set… Continue reading How to Add Colors to Axis Tick Label in ggplot2
How to Add Error Values to Barplot Labels in R with ggplot2

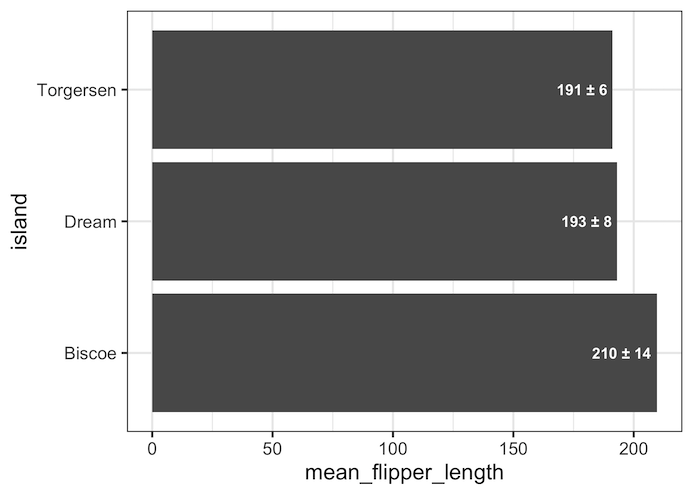
In this tutorial, we will learn how to add error values as labels on bars in a barplot. Thanks to @charliejhadley‘s nice tip showing how to add errors on barplot labels using str_glue() function. The main idea behind adding errors to labels is very similar to adding barplot heights as labels. In addition to the… Continue reading How to Add Error Values to Barplot Labels in R with ggplot2
Bump Plot with ggbump

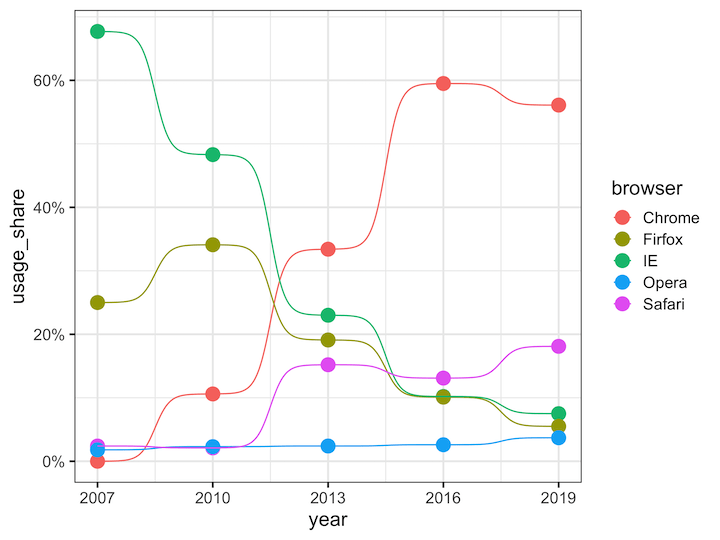
Bump plots are line plots with dots showing the data points. Bump plots can be useful in understanding the change in rank over time. In this tutorial, we will learn how to make bump plots using ggbump package, a ggplot2 extension package. To make a bump plot we will use the top browser usage over… Continue reading Bump Plot with ggbump