
In this post we will learn how to make a grouped boxplots with reproducible jittered points.
We can make a grouped boxplot with jittered points using position_jitterdodge() function as position argument to geom_point().
p0_1 <- penguins %>%
  drop_na() %>%
  ggplot(aes(x = species,
             y = bill_length_mm,
             color = sex))+
  geom_boxplot(outlier.shape = NA)+
  geom_point(position = position_jitterdodge())+
  theme(legend.position = "none")
print(p0_1)
ggsave("grouped_boxplot_with_jittered_points_ggplot2.png")
Note that using the handy wrapper function geom_jitter() instead of geom_point() with position_jitterdodge() will not give right plot with jittered data.

If we use the same code again to create a grouped boxplot, the resultiung plot will be slightly different due to the added randomness while jittering data points along the x-axis. Notice the differences in the data positions in the two boxplots below.


Grouped Boxplots with reproducible jittered data points
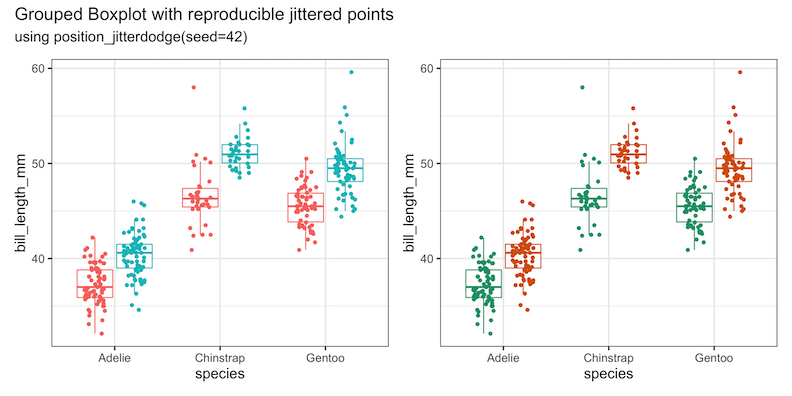
To make a grouped boxplot with reproducible jittered data points, we need to use seed argument inside ” position_jitterdodge()” function instead of position_jitter() function.
p1 <- penguins %>%
  drop_na() %>%
  ggplot(aes(x = species,
             y = bill_length_mm,
             color=sex))+
  geom_boxplot(outlier.shape = NA)+
  geom_point(position = position_jitterdodge(seed = 42))+
  theme(legend.position = "none")
Let us make the same plot using the same seed but with different color palette
p2 <- penguins %>%
  drop_na() %>%
  ggplot(aes(x = species,
             y = bill_length_mm,
             color = sex))+
  geom_boxplot(outlier.shape = NA)+
  geom_point(position = position_jitterdodge(seed = 42))+
  theme(legend.position = "none")+
  scale_color_brewer(palette="Dark2")
We can see that we have successfully reproduced jittered data points in a grouped boxplot.
print(p1+p2+plot_annotation(
  title = 'Grouped Boxplot with reproducible jittered points',
  subtitle='using position_jitterdodge(seed=42)'))
ggsave("grouped_boxplot_with_reproducible_jittered_points_ggplot2.png",
       width=12, height=6)
Explore the Complete ggplot2 Guide
35+ tutorials with code: scatterplots, boxplots, themes, annotations, facets, and more—tested and beginner-friendly.
Visit the ggplot2 Hub → No fluff—just code and visuals.


