
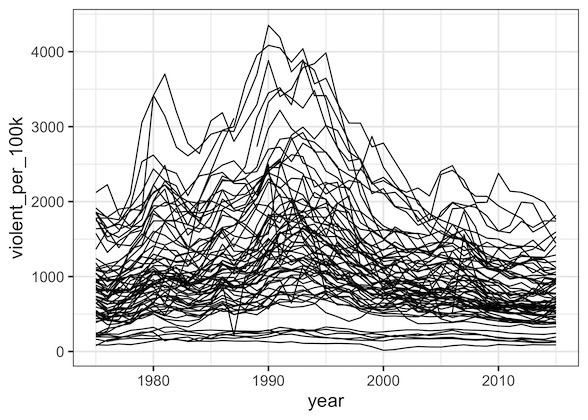
Line plots or time series plots are helpful to understand the trend over time. In this post we will learn how to make multiple line plots (or time-series plots in the sample plot) in R using ggplot2. Let us load tidyverse the suite of R packages including ggplot2 to make the line plots. We will… Continue reading Multiple Line Plots or Time Series Plots with ggplot2 in R