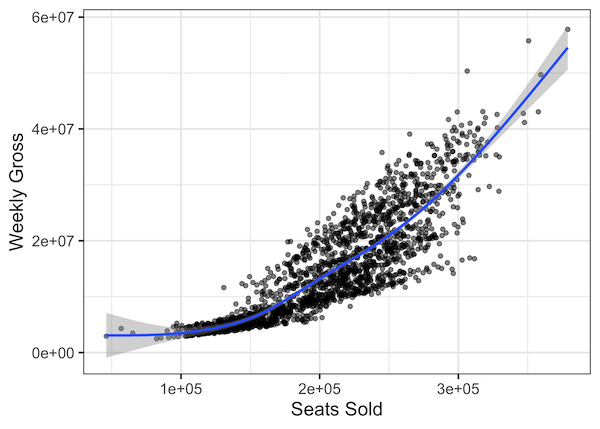
Adding regression line to scatter plot can help reveal the relationship or association between the two numerical variables in the scatter plot. With ggplot2, we can add regression line using geom_smooth() function as another layer to scatter plot. In this post, we will see examples of adding regression lines to scatterplot using ggplot2 in R.… Continue reading How To Make Scatter Plot with Regression Line with ggplot2 in R?
