
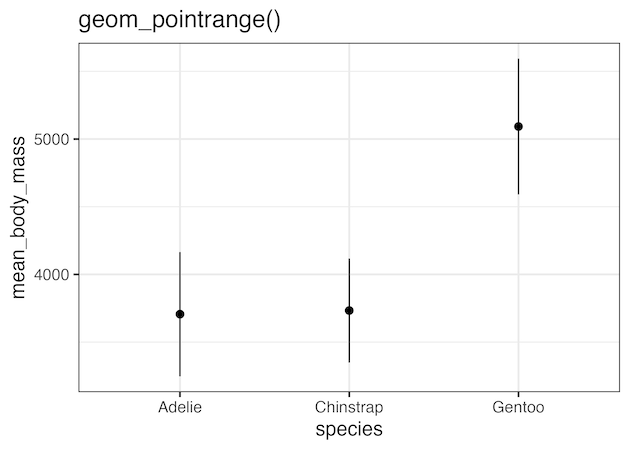
In this post, we will learn about four geoms in ggplot2 that are useful for revealing uncertainty in numerical variables with multiple categories. The four geoms, geom_errorbar(), geom_linerange(), geom_crossbar(), and geom_pointrange() are useful when we have categeorical x values and we are interested in the “distribution of y conditional on x and use the aesthetics… Continue reading Four geoms in ggplot2 to visualize uncertainty