
In this post, we will learn about four geoms in ggplot2 that are useful for revealing uncertainty in numerical variables with multiple categories. The four geoms, geom_errorbar(), geom_linerange(), geom_crossbar(), and geom_pointrange() are useful when we have categeorical x values and we are interested in the “distribution of y conditional on x and use the aesthetics ymin and ymax to determine the range of the y values”. The third edition of ggplot2 book has a great chapter describing these geoms.
Let us get started by loading tidyverse and palmer penguin pacakges.
library(tidyverse)
library(palmerpenguins)
theme_set(theme_bw(16))
df <- penguins %>%
  drop_na() %>%
  group_by(species) %>%
  summarize(n= n(),
            mean_body_mass= mean(body_mass_g),
            sd = sd(body_mass_g))
df

# A tibble: 3 × 4
  species       n mean_body_mass    sd
  <fct>     <int>          <dbl> <dbl>
1 Adelie      146          3706.  459.
2 Chinstrap    68          3733.  384.
3 Gentoo      119          5092.  501.
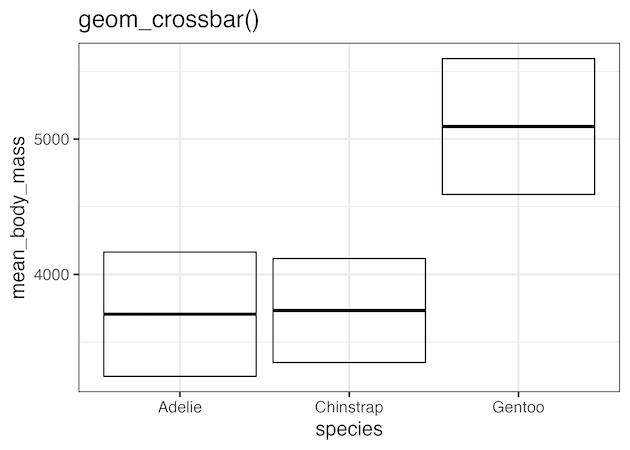
Visualizing Uncertainty with geom_crossbar()
df %>%
  ggplot(aes(species, mean_body_mass,
                  ymin = mean_body_mass - sd,
                  ymax = mean_body_mass + sd)) +
  geom_crossbar()
ggsave("visualizing_uncertainty_with_geom_crossbar.png")
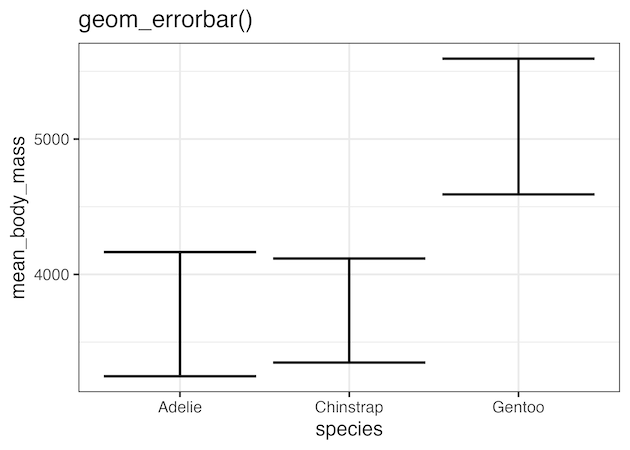
Visualizing Uncertainty with geom_errorbar()
df %>%
  ggplot(aes(species, mean_body_mass,
                  ymin = mean_body_mass - sd,
                  ymax = mean_body_mass + sd)) +
  geom_errorbar(linewidth = 1)
ggsave("visualizing_uncertainty_with_geom_errorbar.png")
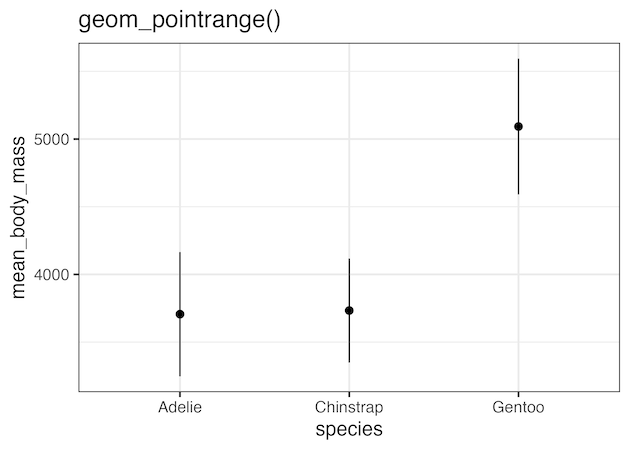
Visualizing Uncertainty with geom_pointrange()
df %>%
  ggplot(aes(species, mean_body_mass,
                  ymin = mean_body_mass - sd,
                  ymax = mean_body_mass + sd)) +
  geom_pointrange()
ggsave("visualizing_uncertainty_with_geom_pointrange.png")
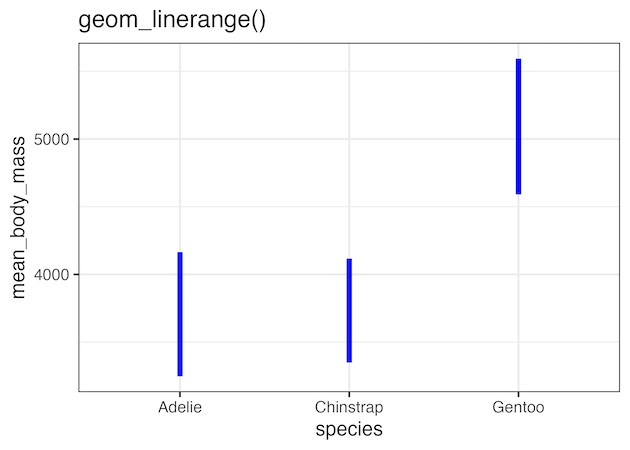
Visualizing Uncertainty with geom_linerange()
df %>%
  ggplot(aes(species, mean_body_mass,
                  ymin = mean_body_mass - sd,
                  ymax = mean_body_mass + sd)) +
  geom_linerange(color="blue", linewidth=2)
ggsave("visualizing_uncertainty_with_geom_linerange.png")
Explore the Complete ggplot2 Guide
35+ tutorials with code: scatterplots, boxplots, themes, annotations, facets, and more—tested and beginner-friendly.
Visit the ggplot2 Hub → No fluff—just code and visuals.


