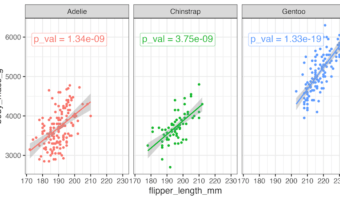
This tutorial shows you how to add p-value to each facet in ggplot2 when creating multi-panel plots in R. Using a scatter plot example, we’ll perform linear regression analysis for each facet to determine statistical significance. And then we will display the corresponding … [Read more...] about How to add P-value to each facet in ggplot2
facet_wrap ggplot2
How to Move Facet strip label to the bottom
In this tutorial, we will learn how to move the strip label title text in ggplot2's facet* functions to the bottom. By default, facet_wrap() creates a box for each strip with a label at the top of the small multiple plot. In this post, we will show how to move the strip label to … [Read more...] about How to Move Facet strip label to the bottom
How To Customize Border in facet in ggplot2
Faceting in ggplot2 is one of the most powerful ways to create small multiples—a series of plots split by a grouping variable. With facet_wrap() and facet_grid(), you can easily compare distributions, trends, or relationships across categories. New to facets? Start here: How … [Read more...] about How To Customize Border in facet in ggplot2
How To Remove facet_wrap Title Box in ggplot2?
In this tutorial, we will see how to remove box surrounding title of each facets made with facet_wrap() function in ggplot2. Let us load tidyverse and set ggplot2 theme_bw() with base size 16. Let us use Palmer penguin dataset to make plots with facets using facet_wrap() in … [Read more...] about How To Remove facet_wrap Title Box in ggplot2?
How To Change facet_wrap() Box Color in ggplot2?
Facetting is a great way to show relationship between more than two variables. When you have three variables, with faceting one can splot a single plot into smaller plots with subset of data corresponding to the third variable. In ggplot2, we can easily make facetted plot using … [Read more...] about How To Change facet_wrap() Box Color in ggplot2?