
When you have a multiple groups and subgroups within each groups with associated numerical values, we can use Grouped boxplots to visualize. With Seaborn we can make grouped boxplots using boxplot() function and much newer function Catplot(). Seaborn Catplot is a function that … [Read more...] about How To Make Grouped Boxplot with Seaborn Catplot?
Python
How To Use Seaborn Color Palette to Color Boxplot

Adding right set of colors to plot can reveal a pattern that is not seen before. Seaborn Color Palettes makes it really easy to add group of suitable colors to your data visualization. In this post, we will learn how to use Seaborn Color Palettes to color a boxplot made with … [Read more...] about How To Use Seaborn Color Palette to Color Boxplot
How To Manually Order Boxplot in Seaborn?

In this post we will learn how to manually sort boxes in boxplot when using Seaborn's boxplot function in Python. Earlier we saw how to order a boxplot in Python by another variable, for example we ordered boxplot by mean/median using Seaborn. Sometimes, you may already know … [Read more...] about How To Manually Order Boxplot in Seaborn?
How to Make Horizontal Violin Plot with Seaborn in Python?

In this tutorial, we will learn how to make horizontal violin plot in Seaborn with Python. With Seaborn, we can use two similar functions, catplot() and violinplot() to make violin plots. Making a violinplot horizontal with Seaborn is pretty simple. All we need to do is specify … [Read more...] about How to Make Horizontal Violin Plot with Seaborn in Python?
Scatter Plot with Marginal Histograms in Python with Seaborn
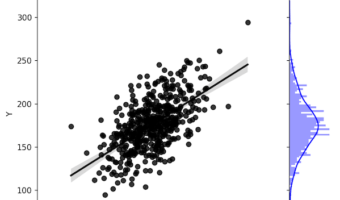
Sometimes when you make a scatter plot between two variables, it is also useful to have the distributions of each of the variables on the side as histograms. Scatter plots with marginal histograms on the side is a great way to do that. We can use Seaborn jointplot() function in … [Read more...] about Scatter Plot with Marginal Histograms in Python with Seaborn