• Skip to primary navigation
  • Skip to main content
  • Skip to primary sidebar

Data Viz with Python and R

Learn to Make Plots in Python and R

  • Home
  • Seaborn
  • Matplotlib
  • ggplot2
  • Altair
  • About
    • Privacy Policy
  • Visualizing Activation Functions in Neural Networks
  • Confusion Matrix Calculator
  • Visualizing Dropout Rate in Neural Network
  • Visualizing Loss Functions in Neural Networks
  • Show Search
Hide Search

Python

How to Make a Simple Histogram with Altair in Python?

datavizpyr · December 13, 2019 ·

Histogram with Altair

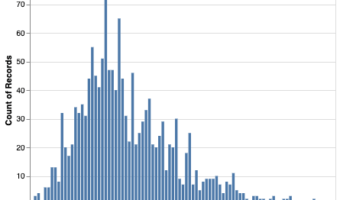
Altair is the newest to Pyhon's Data Visualization landscape. In this post we will see a simple example of making a histogram using Python's Altair package. Let us import Altair as alt and also import data from vega_datasets. We will use weather data set from … [Read more...] about How to Make a Simple Histogram with Altair in Python?

Filed Under: Altair, Histogram with Altair, Python Tagged With: Python

Simple Scatter Plot with Altair in Python

datavizpyr · December 12, 2019 ·

Simple Scatter Plot with Altair in Python

In this post, we will see an example of making a simple scatter plot using Altair 4.0.0. Altair is one latest interactive data visualization library in Python. Altair is based vega and Vega-lite - A Grammar of Interactive Graphics. Let us load Seattle weather data from … [Read more...] about Simple Scatter Plot with Altair in Python

Filed Under: Altair, Python, Scatter Plot, Scatter Plot with Altair Tagged With: Altair, Python

  • « Go to Previous Page
  • Page 1
  • Interim pages omitted …
  • Page 17
  • Page 18
  • Page 19

Primary Sidebar

Python & R Viz Hubs

  • Seaborn Guide & Cookbook
  • ggplot2 Guide & Cookbook
  • Matplotlib Guide & Cookbook
  • Confusion Matrix Calculator
  • Visualizing Activation Functions
  • Visualizing Dropout
  • Visualizing Loss Functions

Buy Me a Coffee

Copyright © 2026 · Daily Dish Pro on Genesis Framework · WordPress · Log in

Go to mobile version