
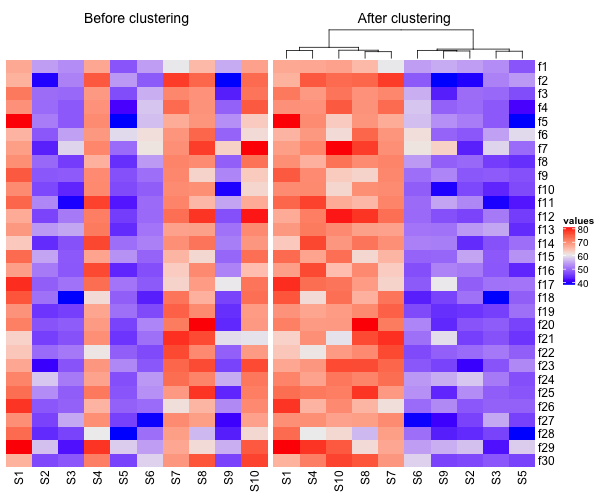
Heatmaps are a great way visualize a numerical dataset in a matrix form. Basically, a heatmap shows the actual data values as colors. When there is a broad trend in data, like change in data over rows or columns of data, a heat map makes it easy to see the broader trend. In this tutorial,… Continue reading How To Make Heatmaps in R with ComplexHeatmap?