

Boxplots in R: Manual, ChatGPT/AI, and Hybrid Approaches in the AI Era If you’re a data analyst or scientist, your workflow in 2025 probably looks a lot different than it did just a few years ago. The buzz around AI coding assistants like GitHub Copilot and large language models like Gemini or ChatGPT isn’t just… Continue reading ggplot2 Boxplot AI Workflows: A Modern Guide
Tag: ggplot boxplot
How to Make Boxplot with a Line Connecting Mean Values in R?

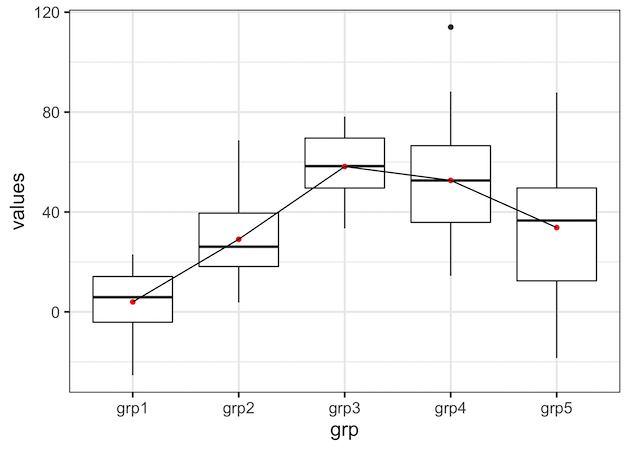
In this post, we will learn how to draw a line connecting the mean (or median) values in a boxplot in R using ggplot2. Connecting mean or median values in each group i.e. each box in boxplot can help easily see the pattern across different groups. The basic idea in making a boxplot with a… Continue reading How to Make Boxplot with a Line Connecting Mean Values in R?
Reorder Boxplots in R (ggplot2): 4 Easy Examples

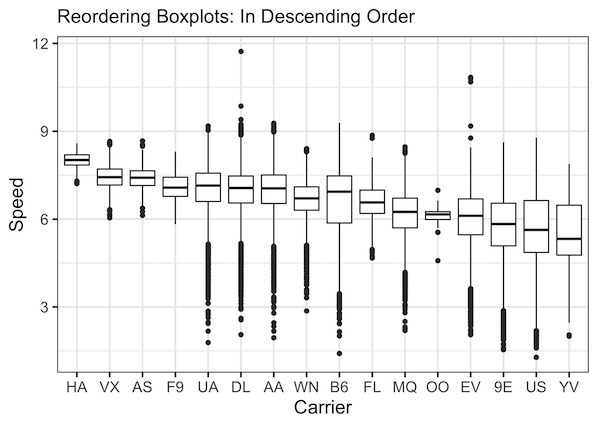
Why Reorder Boxplots in ggplot2? By default, ggplot2 arranges categorical variables alphabetically. Reordering boxplots by a numeric summary (mean or median) helps highlight patterns—like which airlines fly fastest on average. This makes your visualization more interpretable and presentation-ready. In this post, we will learn how to re-order boxplots in R with ggplot2. We will make… Continue reading Reorder Boxplots in R (ggplot2): 4 Easy Examples