• Skip to primary navigation
  • Skip to main content
  • Skip to primary sidebar

Data Viz with Python and R

Learn to Make Plots in Python and R

  • Home
  • Seaborn
  • Matplotlib
  • ggplot2
  • Altair
  • About
    • Privacy Policy
  • Visualizing Activation Functions in Neural Networks
  • Confusion Matrix Calculator
  • Visualizing Dropout Rate in Neural Network
  • Visualizing Loss Functions in Neural Networks
  • Show Search
Hide Search

Boxplot

How To Make Boxplots with Seaborn in Python?

datavizpyr · December 14, 2019 ·

Boxplot with Catplot Seaborn Python

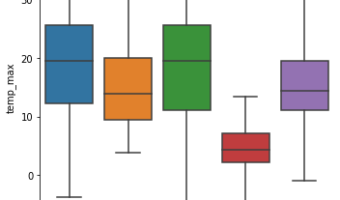
Boxplot is a way to visualize quantitative/numeric variable, in a concise way using quartiles of a data distribution. Here, we will see examples of making simple boxplots using Seaborn in Python. Let us first load packages needed for making boxplot. We will use weather … [Read more...] about How To Make Boxplots with Seaborn in Python?

Filed Under: Python, Python Boxplot, Seaborn, Seaborn Boxplot Tagged With: Boxplot, Python, Seaborn

  • « Go to Previous Page
  • Page 1
  • Page 2
  • Page 3

Primary Sidebar

Python & R Viz Hubs

  • Seaborn Guide & Cookbook
  • ggplot2 Guide & Cookbook
  • Matplotlib Guide & Cookbook
  • Confusion Matrix Calculator
  • Visualizing Activation Functions
  • Visualizing Dropout
  • Visualizing Loss Functions

Buy Me a Coffee

Copyright © 2026 · Daily Dish Pro on Genesis Framework · WordPress · Log in

Go to mobile version