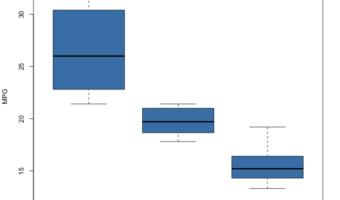
In this post, we will learn how to make simple boxplots using base R function boxplot(). We will use mtcars dataset available readily in R to first make a simple boxplot using boxplot() function in base R. And then we will learn how to customize the boxplot with specifying x and … [Read more...] about How To Make Boxplots in base R?
Boxplot
How To Make Grouped Boxplot with Seaborn Catplot?

When you have a multiple groups and subgroups within each groups with associated numerical values, we can use Grouped boxplots to visualize. With Seaborn we can make grouped boxplots using boxplot() function and much newer function Catplot(). Seaborn Catplot is a function that … [Read more...] about How To Make Grouped Boxplot with Seaborn Catplot?
How To Manually Order Boxplot in Seaborn?

In this post we will learn how to manually sort boxes in boxplot when using Seaborn's boxplot function in Python. Earlier we saw how to order a boxplot in Python by another variable, for example we ordered boxplot by mean/median using Seaborn. Sometimes, you may already know … [Read more...] about How To Manually Order Boxplot in Seaborn?
Grouped Boxplots in Python with Seaborn
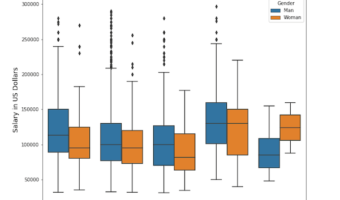
In this post, we will learn how to make grouped boxplots in Python using Seaborn's boxplot function. Grouped boxplots are a great way to visualize when you have three variables, where one of them is a numerical variable and the other two are categorical variables. Let us load … [Read more...] about Grouped Boxplots in Python with Seaborn
How To Color Boxplots By a Variable in R with ggplot2?

In this tutorial, we learn how to color boxplots in R by a variable. With ggplot2 in R, we can color boxplots in multiple ways. In this post, we will first see how to make a simple boxplot in R. And then we will learn how to fill the boxes on boxplot by a variable. Then we will … [Read more...] about How To Color Boxplots By a Variable in R with ggplot2?