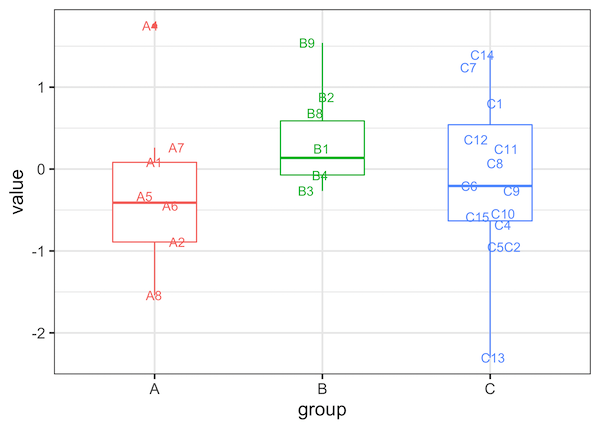
Boxplots with overlayed data points is a great way visualize multiple distributions. One of the biggest benefits of adding data points over the boxplot is that we can actually see the underlying data instead of just the summary stat level data visualization. Sometimes using text labels instead of data points can be helpful as it… Continue reading How To Make Boxplots with Text as Points in R using ggplot2?
