• Skip to primary navigation
  • Skip to main content
  • Skip to primary sidebar

Data Viz with Python and R

Learn to Make Plots in Python and R

  • Home
  • Seaborn
  • Matplotlib
  • ggplot2
  • Altair
  • About
    • Privacy Policy
  • Visualizing Activation Functions in Neural Networks
  • Confusion Matrix Calculator
  • Visualizing Dropout Rate in Neural Network
  • Visualizing Loss Functions in Neural Networks
  • Show Search
Hide Search

boxplot with jiitered text labels

How To Make Boxplots with Text as Points in R using ggplot2?

datavizpyr · April 13, 2020 ·

Boxplot with jittered text labels as points in R

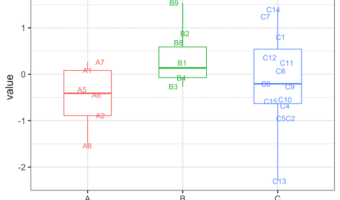
Boxplots with overlayed data points is a great way visualize multiple distributions. One of the biggest benefits of adding data points over the boxplot is that we can actually see the underlying data instead of just the summary stat level data visualization. Sometimes using text … [Read more...] about How To Make Boxplots with Text as Points in R using ggplot2?

Filed Under: ggplot2, R Tagged With: boxplot with jiitered text labels

Primary Sidebar

Python & R Viz Hubs

  • Seaborn Guide & Cookbook
  • ggplot2 Guide & Cookbook
  • Matplotlib Guide & Cookbook
  • Confusion Matrix Calculator
  • Visualizing Activation Functions
  • Visualizing Dropout
  • Visualizing Loss Functions

Buy Me a Coffee

Copyright © 2026 · Daily Dish Pro on Genesis Framework · WordPress · Log in

Go to mobile version