In ggplot2, we can adjust the position of legend easily. By default, ggplot2 places the legend on the right side of a plot. Using theme() function, we can move the legend to the bottom of or top of the plot. Sometime, you might like to customize the space between legend at bottom and x-axis. In this tutorial, we will learn how to reduce the space between the legend, that is placed at the bottom of a plot, and x-axis.
Loading packages and data
Let us get started with loading the packages needed and the dataset needed.
library(tidyverse)
theme_set(theme_bw(20))
We will use the student debt data from tidytuesday project.
student_debt <- read_csv("https://raw.githubusercontent.com/rfordatascience/tidytuesday/master/data/2021/2021-02-09/student_debt.csv")

student_debt %>% head()
We will use the student debt data for two years alone to make stacked barplot, with bars placed side by side.
debt_df <- student_debt %>%
  filter(year %in% c(1989,2016)) %>%
  mutate(year=as.character(year))
Side-by-Side Barplot with legend at the bottom
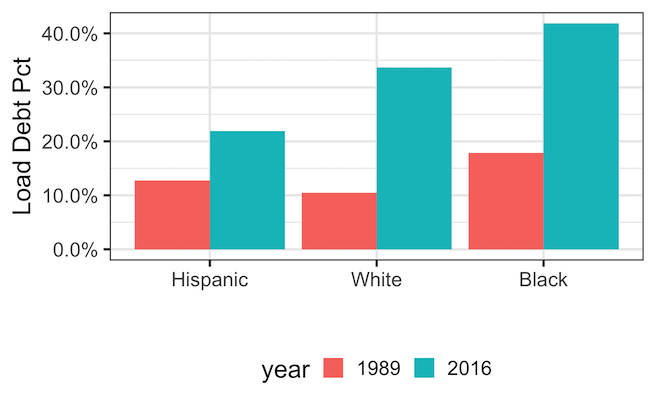
Let us make a side-by-side barplot with legend placed at the bottom using ggplot2’s legend.position=”bottom”. In this plot, we have also removed the x-axis title name as it is redundant to the plot.
p1 <- debt_df %>%
  ggplot(aes(x = forcats::fct_reorder(race, loan_debt_pct),
             y = loan_debt_pct,
             fill=year))+
  geom_col(position="dodge")+
  theme(legend.position="bottom")+
  labs(x="",
       y="Load Debt Pct")+
  scale_y_continuous(labels = scales::percent,
                     breaks = scales::pretty_breaks(n = 6))
print(p1)
ggsave("barplot_with_legend_at_bottom_ggplot2.png")
Note the spacing between legend at the bottom and the x-axis. It has extra space as we have removed the x-axis title text.

Reduce space between legend at bottom and x-axis using legend.margin
We can adjust the spacing between legend and x-axis using legend.margin argument to theme() function in addition to specifying legend.position. To reduce the spacing between legend and x-axis we using margin(t=-25) in the plot below.
p2 <- debt_df %>%
  ggplot(aes(x = forcats::fct_reorder(race, loan_debt_pct),
             y = loan_debt_pct,
             fill = year))+
  geom_col(position="dodge")+
  labs(x="",
       y="Load Debt Pct")+
  scale_y_continuous(labels = scales::percent,
                     breaks = scales::pretty_breaks(n = 6)) +
  theme(legend.position = "bottom",
        legend.margin=margin(t=-25))
print(p2)
ggsave("how_to_reduce_the_space_between_legend_bottom_and_x_axis_ggplot2.png")
Now we have a nice looking barplot with less space between the legend at bottom and x-axis.

Here is a look at before and after removing the space between the legend placed at bottom and x-axis.
print(p1+p2)
ggsave("remove_space_between_bottom_legend_and_x_axis_before_and_after.png",
       width=12, height=6)

P.S It has taken dog years for me to find a better solution, i.e. avoid making a mistake :-). h/t to Cedric Scherer on @twitter. At the outset I could have avoided creating extra space by not specifying x-axis label as empty string, x=””, inside labs. By using x=NULL, there won’t be an empty space to start with 🙂


