Last updated on August 22, 2025
Want to make your plot titles stand out and look more professional? This comprehensive guide shows you exactly how to make title bold ggplot2 using multiple styling methods, with ready-to-use code examples.
Plot titles are crucial for communicating your data’s main message, but default ggplot2 titles often appear too subtle for presentations, publications, or dashboards. Making titles bold instantly improves readability and creates visual hierarchy that guides your audience’s attention to the most important information.
In this tutorial, you’ll master ggplot2 title bold formatting using theme(), element_text(), and advanced styling options. Whether you’re creating academic plots, business reports, or data visualizations for social media, these techniques will help you create professional-looking titles that command attention.
One of the common failures of making a data visualization is either not having a title for plot or having a title that is not easy to read. Making the title in bold can help making the visualization better. In this post, we will learn how to make the title of plot made with ggplot bold font.
Setting Up
Let us load tidyverse, the suite of R packages from RStudio.
library(tidyverse)
theme_set(them_bw())
Note: We use theme_set(theme_bw()) to apply a clean black-and-white theme to all subsequent plots for better readability.
We will use cars data that is inbuilt with R.
head(cars)
##   speed dist
## 1     4    2
## 2     4   10
## 3     7    4
## 4     7   22
## 5     8   16
## 6     9   10
Plot with Default Title
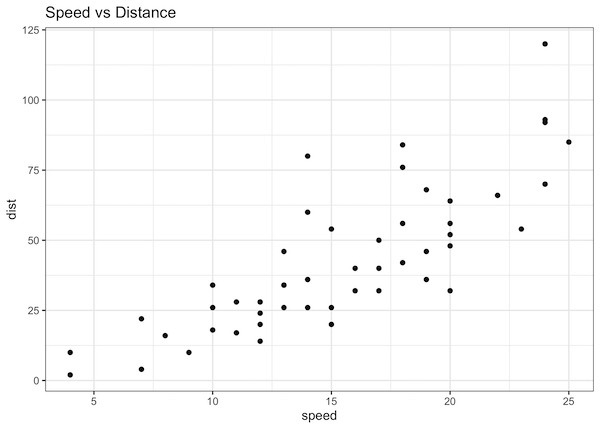
Let us make a scatter plot with speed on x-axis and dist on y-axis using geom_point(). We will also add a title using ggplot function labs().
# Create a scatter plot with a default title
cars |>
  ggplot(aes(x=speed, y=dist)) +
  geom_point()+
  labs(title="Speed vs Distance")
By default the title made by ggplot2 is not in bold font.
Making the title text bold in ggplot2
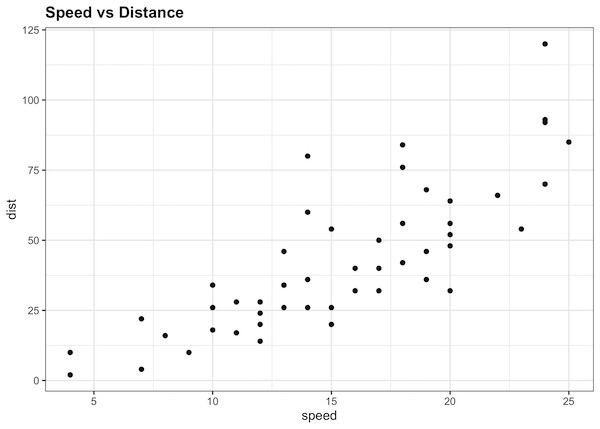
We can make the title of a plot bold in ggplot2 using theme() function. The theme function can handle many aspects of the ggplot2 theme including title. To change the title font to bold, we can use plot.title argument and specify element_text(face=”bold”) as shown below.
cars |>
  ggplot(aes(x=speed,y=dist)) +
  geom_point()+
  labs(title="Speed vs Distance")+
  theme(plot.title = element_text(face="bold"))
And now our plot’s title is bold as we wanted.
Increase the title text size
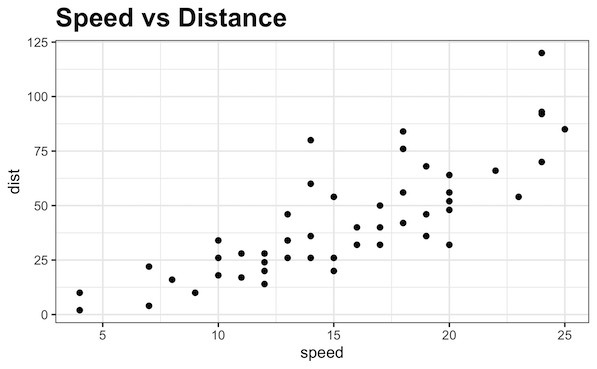
We can also increase the size of the text using size argument inside element_text() in addition to the face=bold argument.
cars |>
  ggplot(aes(x=speed,y=dist)) +
  geom_point()+
  labs(title="Speed vs Distance")+
  theme(plot.title = element_text(face="bold", size=24))
Now we have the title with larger fontsize and in bold.
Beyond Bold: Combining Size, Color, and Alignment
The element_text() function is very powerful and accepts more arguments than just face. You can combine multiple arguments to fully customize your title. Some of the most common ones are:
- size: An integer to control the font size.
- color: A string with the name of a color (e.g., “blue”, “#c0392b”).
- hjust: A number from 0 (left-align) to 1 (right-align). Use 0.5 to center the title.
Let’s make our title bold, larger, center-aligned, and a dark blue color. We’ll also add a subtitle for context and style it differently to make the plot publication quality.
cars |>
  ggplot(aes(x = speed, y = dist)) +
  geom_point() +
  labs(
    title = "Car Speed vs. Stopping Distance",
    subtitle = "Data from the 1920s",
    caption = "Source: 'cars' dataset in R"
  ) +
  theme(
    plot.title = element_text(
      face = "bold",   # Make the title bold
      size = 18,       # Increase the font size
      color = "#2c3e50", # A dark slate gray color
      hjust = 0.5      # Center-align the title
    ),
    plot.subtitle = element_text(
      face = "italic", # Italicize the subtitle
      size = 12,
      hjust = 0.5
    ),
    plot.caption = element_text(
      hjust = 1, # Right-align the caption
      face = "italic"
    )
  )
ggsave("ggplot2_change_title_text_bold_size_font_color.png")

Now our plot has a professional, well-structured title block that is easy to read and visually appealing.
Key Takeaways
- To style non-data elements, use the theme() function.
- The specific component for the main title is plot.title. For subtitles and captions, use plot.subtitle and plot.caption.
- Use the element_text() function to control text appearance.
- Set face = “bold” inside element_text() to make the title bold.
- Combine other arguments like size, color, and hjust within element_text() for complete control over your plot’s text.
ggplot2 title formatting: Frequently Asked Questions
1. How do I make the subtitle or caption bold?
You use the exact same technique, but you target the plot.subtitle or plot.caption elements within the theme() function.
library(ggplot2)
cars |>
  ggplot(aes(x = speed, y = dist)) +
  geom_point() +
  labs(
    title = "Main Title (Plain)",
    subtitle = "My Subtitle (Bold)",
    caption = "My Caption (Bold)"
  ) +
  theme(
    plot.subtitle = element_text(face = "bold"),
    plot.caption = element_text(face = "bold")
  )
2. How can I change other text, like axis titles, to bold?
The principle is identical. You just need to know the name of the theme element to modify, such as axis.title.x, axis.title.y, or legend.title.
# Example using the iris dataset for a legend
iris |>
  ggplot(aes(x = Sepal.Length, y = Sepal.Width, color = Species)) +
  geom_point() +
  labs(
    x = "Sepal Length (Bold)",
    y = "Sepal Width (Bold)",
    color = "Species (Bold)" # This is the legend title
  ) +
  theme(
    axis.title.x = element_text(face = "bold"),
    axis.title.y = element_text(face = "bold"),
    legend.title = element_text(face = "bold")
  )
3. Can I make the title bold and italic?
Yes, the face argument in element_text() accepts "bold.italic" as a value.
cars |>
  ggplot(aes(x = speed, y = dist)) +
  geom_point() +
  labs(title = "Bold and Italic Title") +
  theme(plot.title = element_text(face = "bold.italic",
                                  hjust = 0.5,
                                  size = 16))
4. How can I set bold titles as the default for all my plots?
Instead of adding a theme() layer to every plot, you can use theme_update() once at the beginning of your script. This will modify the active theme for the entire R session.
# Update the theme for the rest of the R session
theme_update(plot.title = element_text(face = "bold", hjust = 0.5))

# Now, any new plot will have a bold, centered title automatically
cars |>
  ggplot(aes(x = speed, y = dist)) +
  geom_point() +
  labs(title = "This Title is Bold by Default")
5. My theme already has a bold title. How do I make it plain?
Some custom themes might default to a bold title. To override this and ensure the title is plain, simply specify face = "plain" in element_text().
cars |>
  ggplot(aes(x = speed, y = dist)) +
  geom_point() +
  labs(title = "This Title is Plain") +
  theme(
    # This ensures the title is plain, overriding any theme defaults
    plot.title = element_text(face = "plain")
  )
Explore the Complete ggplot2 Guide
35+ tutorials with code: scatterplots, boxplots, themes, annotations, facets, and more—tested and beginner-friendly.
Visit the ggplot2 Hub → No fluff—just code and visuals.