
In this tutorial, you’ll learn how to make axis tick labels bold in ggplot2 using the theme() function. Axis tick labels are the text that appears below x-axis and beside y-axis tick marks. Bold axis labels improve chart readability and make your data visualizations more professional.
We’ll cover how to bold all axis labels at once, target specific axes (x or y only), and combine bold formatting with other customizations like font size and color.
library(tidyverse)
library(palmerpenguins)
theme_set(theme_bw(16))
How to make axis tick labels bold?
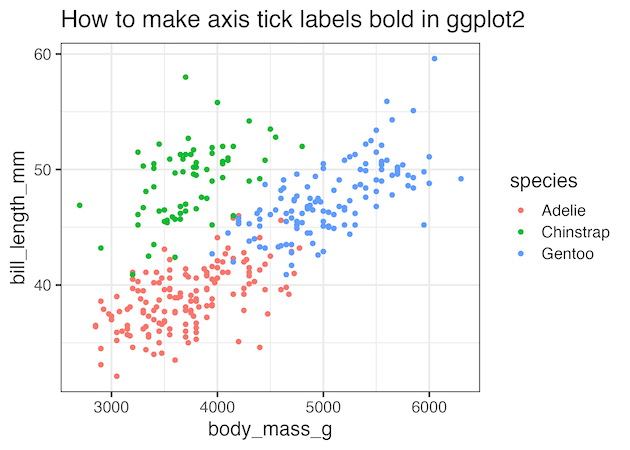
Let us use a scatter plot made with ggplot2 to show how to make the axis tick labels bold.
penguins |>
  ggplot(aes(body_mass_g, bill_length_mm, color=species))+
  geom_point()+
  labs(title="How to make axis tick labels bold in ggplot2")
ggsave("how_to_make_axis_tick_labels_bold_ggplot2.png")
Notice that the tick labels are not bold by default in ggplot.
Make X-axis tick labels bold using axis.text.x
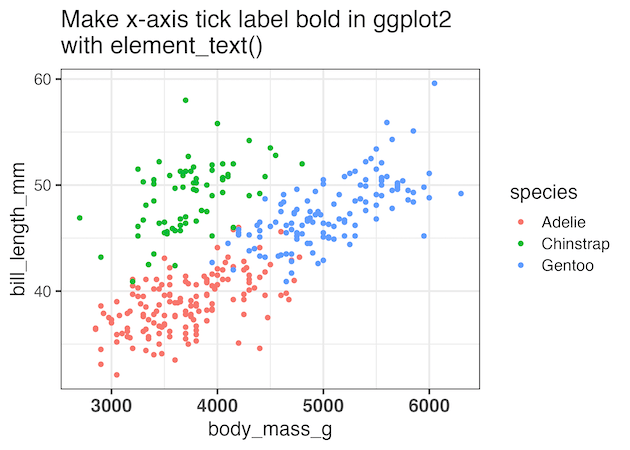
ggplot2 offers great controls over how to customize axis tick labels. If you are interested in just making the x-axis tick labels, we can use axis.text.x as argument to theme() function as shown below. In the examples, in this post we have also changed the a href=”https://datavizpyr.com/change-axis-tick-label-size-in-ggplot2/”>tick label size using size argument to element_text()..
penguins |>
  ggplot(aes(body_mass_g, bill_length_mm, color=species)) +
  geom_point() +
  theme(axis.text.x= element_text(size=15,
                                     face="bold"))+
  labs(title=stringr::str_wrap("Make X-axis tick label
                                bold in ggplot2 with element_text()", width=40))
ggsave("make_x_axis_tick_labels_bold_ggplot2_using_theme.png")
Make y-axis tick labels bold using axis.text.y
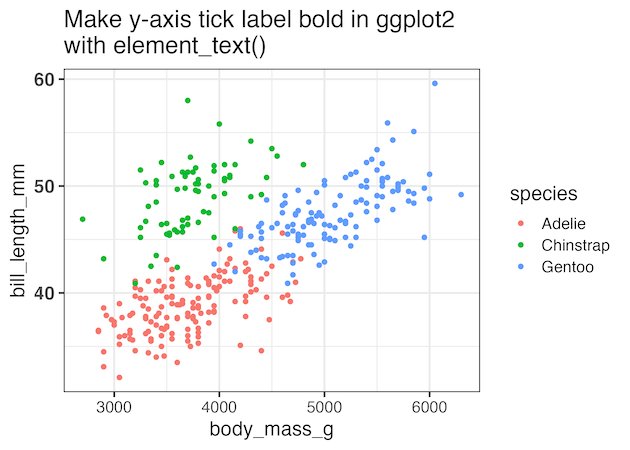
Similarly, we can make the y-axis tick labels bold, by using axis.text.y as argument to theme() function as shown below.
penguins |>
  ggplot(aes(body_mass_g, bill_length_mm, color=species))+
  geom_point() +
  theme(axis.text.y= element_text(size=15,
                                     face="bold"))+
  labs(title=stringr::str_wrap("Make y-axis tick label
                                bold in ggplot2 with element_text()", width=40))
ggsave("make_y_axis_tick_labels_bold_ggplot2_using_theme.png")
Make both the axes tick labels bold using axis.text
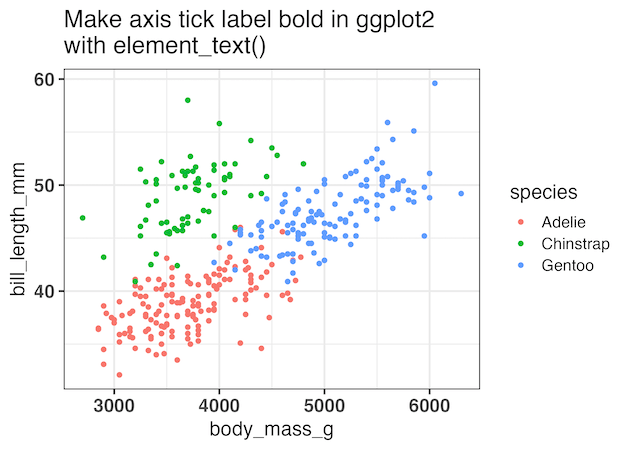
To make both the axes’ tick labels bold, by using axis.text as argument to theme() function with element_text() function. In the examples we also set the size of the axis tick labels as shown below.
penguins |>
  ggplot(aes(body_mass_g, bill_length_mm, color=species))+
  geom_point() +
  theme(axis.text= element_text(size=15,
                                face="bold"))+
  labs(title=stringr::str_wrap("Make axis tick label
                                bold in ggplot2 with element_text()", width=40))
ggsave("make_axis_tick_labels_bold_ggplot2_using_theme.png")
Quick Reference: ggplot2 Bold Axis Labels
| Goal | Code |
|---|---|
| Bold all axis labels | theme(axis.text = element_text(face=”bold”)) |
| Bold x-axis only | theme(axis.text.x = element_text(face=”bold”)) |
| Bold y-axis only | theme(axis.text.y = element_text(face=”bold”)) |
Frequently Asked Questions
Q: Can I make axis labels bold and change their color at the same time?
Yes! You can combine multiple formatting options in element_text(). For example: theme(axis.text = element_text(face="bold", color="red", size=14)) will make labels bold, red, and larger.
Q: How do I make axis titles bold instead of tick labels?
Use axis.title instead of axis.text. For example: theme(axis.title = element_text(face="bold")) for both axes, or axis.title.x and axis.title.y for specific axes.
Q: Does face=”bold” work with custom fonts in ggplot2?
Yes, but the custom font family must have a bold variant available. Specify both the font family and face: element_text(family="Arial", face="bold"). If the bold variant isn’t available, ggplot2 will use the regular weight.
Q: Can I make only some tick labels bold, not all of them?
No, the theme() approach applies formatting to all tick labels on the specified axis. For selective formatting, you’d need to manually create custom labels using scale_x_discrete() with HTML/expression formatting, though this is more complex.
Q: Why aren’t my axis labels appearing bold after using face=”bold”?
Common issues include: 1) Typo in “bold” (case-sensitive), 2) The font family doesn’t have a bold variant, 3) Conflicting theme settings applied later. Try using a standard font like Arial or check your theme order.
Q: What’s the difference between axis.text, axis.text.x, and axis.text.y?
axis.text affects both x and y axis labels simultaneously. axis.text.x targets only the x-axis (horizontal) labels, while axis.text.y targets only the y-axis (vertical) labels. Use the specific ones when you want different formatting for each axis.
Q: Can I save these theme settings to reuse across multiple plots?
Absolutely! Create a custom theme: my_theme , then add it to plots with + my_theme. You can also use theme_set(my_theme) to apply it globally.
Explore the Complete ggplot2 Guide
35+ tutorials with code: scatterplots, boxplots, themes, annotations, facets, and more—tested and beginner-friendly.
Visit the ggplot2 Hub → No fluff—just code and visuals.


