
In this post we will see an example of one of most common errors while making a plot with ggplot2 and how to fix them. Let us we are trying to make a scatter plot using ggplot2 using the following code. Here we use mtcars dataset built-in R to make the scatter … [Read more...] about Error in ggplot(): Mapping should be created with `aes()`
ggplot2
ggplot2 errot: how to fix could not find function “ggplot

In this post we will learn how to fix one of the most common ggplot2 errors, saying "could not find function "ggplot"" Let us consider an example where we are trying to make boxplot using iris, one of the R built-in datasets. We have been extra careful and write a … [Read more...] about ggplot2 errot: how to fix could not find function “ggplot
How to Make Grouped Violinplot with jittered data points in R
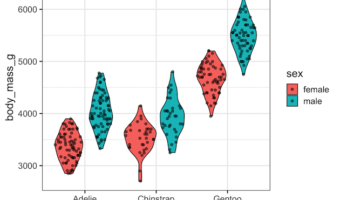
In this post, we will learn how to make grouped violin plot with jittered data points on top of it using ggplot2 in R. One of the challenges in making grouped violin or box plots with jittered data points is proper alignment of data points and the underlying plot. In an earlier … [Read more...] about How to Make Grouped Violinplot with jittered data points in R
How to add water mark on a ggplot
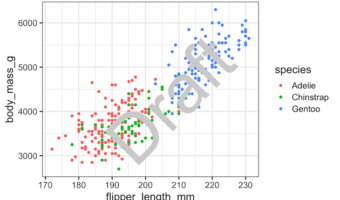
In this tutorial, we will learn how to add water marks to a plot made in R. We will use ggplot2 to make the plot and use the R package cowplot to add water mark on top the plot. The cowplot package developed by Claus Wilke functions to draw with and on plots. These … [Read more...] about How to add water mark on a ggplot
How to Reverse and Reorder Facets in ggplot2 (R) with fct_rev, factor, and fct_relevel
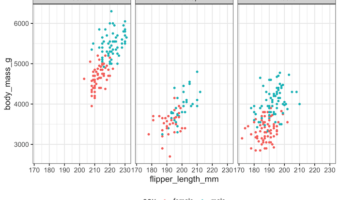
By default, ggplot2 arranges facets in alphabetical order based on the factor levels of the variable you facet by. This behavior is logical but not always useful. Analysts often need to reverse or customize facet order to match reporting requirements, presentation style, or … [Read more...] about How to Reverse and Reorder Facets in ggplot2 (R) with fct_rev, factor, and fct_relevel